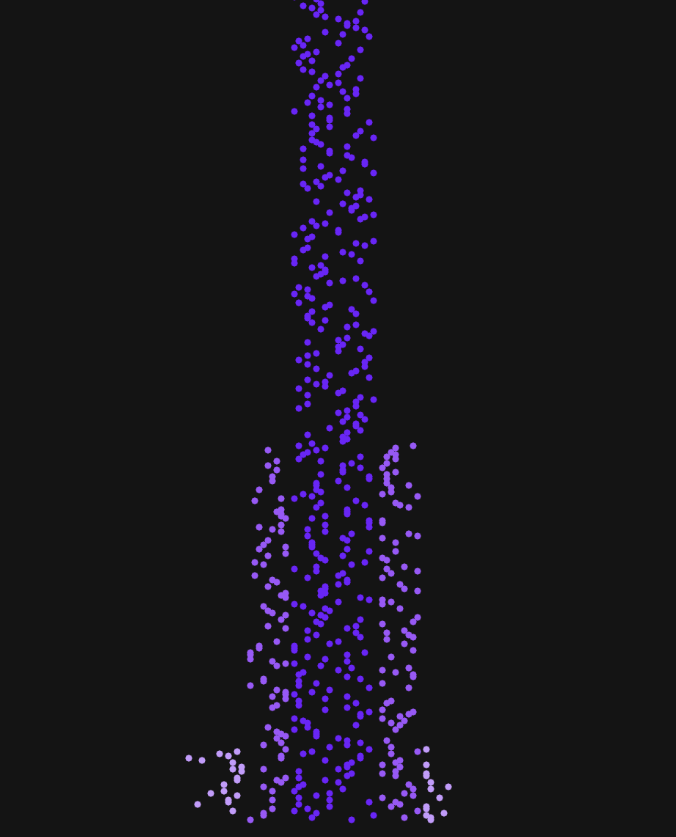
Tearable Dreams

Sketch: https://editor.p5js.org/nkumar23/sketches/GoX7ueD-x

Github: https://github.com/nkumar23/tearcloth2D

Original Plans

I originally entered this final hoping to create a sketch that visualized the quality of my sleep and was controlled by a muscle tension sensor I had already built. I wanted to visualize the entirety of my night’s sleep as a continuous fabric slowly undulating, with holes ripped through it when I clenched my jaw -- detected by the sensor.

I drafted up an initial roadmap that looked like this at a high level (sparing you the detailed steps I created for myself):

  1. Create the fabric using ToxicLibs and p5

    1. Adding forces and texture ripping to Shiffman’s example

      1. Start with mouse/key interactions for rip and forces (like wind/gravity)

  2. Create a clenched/not-clenched classification model

    1. Collect and label sensor data for training

      1. Create simple interface in p5 to record clench/not-clenched with timestamp so that I can label sensor values

      2. Train ml5 neural net using labeled data

  3. Link fabric ripping to sensor data

  4. Run this in real time and capture video of animation during sleep

I headed into this project knowing that I’d most likely tackle chunks 1 and pieces of chunk 2, but likely not the entire thing. Along the way, I wound up focusing entirely on the cloth simulation and abandoned the rest of the project for the time being. I added some audio interaction to round out this project in a way that I thought was satisfying. 

I’ll describe the process behind building this cloth simulation, and what the next steps could look like from here.

Inspiration

As difficult as dreams are to remember, I have short, vivid memories of an undulating surface, slowly changing colors, that at times looks like a grid from the matrix, and at other times looks filled in. As I began thinking of how I might want to visualize my sleep, I went immediately to this sort of flowing fabric-like image.

Luckily, as always seems to be the case, there is a Shiffman example for cloth simulation! I also found this example of a tearable cloth in native Javascript.

Process

I started with Shiffman’s 2D cloth with gravity example. He did the legwork of importing the Toxiclibs library and aliasing some important components, like the gravity behavior.

Rip detection

From that starting point, I first wanted to figure out how to rip the cloth. To begin, I calculated the distance between a clicked mouse and a particle and console logged the particle coordinates when the distance was less than 10 (i.e. which particle was clicked?).

https://editor.p5js.org/nkumar23/sketches/4NsLvcVlO

Rip detection, but make it visual

Next, I wanted to see if these particles were where I expected them to be, and nowhere else. To do this, I displayed the particles rather than the springs and made them change color upon click.

https://editor.p5js.org/nkumar23/sketches/cz2XdRYfH

Spring removal

Then, I wanted to remove springs upon click -- which would “tear” the cloth. To do this, I had to add a reference to the spring within the particle class so that specific springs could be identified upon click.

I spliced spring connections and decided to stop displaying the spring upon click, which led to this aesthetic:

https://editor.p5js.org/nkumar23/sketches/-dtg2SCCy

That doesn’t really look like a cloth was torn! Where’s the fraying? This behavior happened because the springs were not removed from the physics environment-- they were just no longer displayed. 

Removing the springs required adding a bit more logic. Instead of adding springs in the draw loop, we now have the framework for adding/removing springs within the Spring class’ logic. 

In the draw loop, we check whether a spring is essentially marked for removal upon click and remove it via the remove() function created in the Spring class. Thanks Shiffman for the help with that logic! 

https://editor.p5js.org/nkumar23/sketches/uykP2GyE2

Adding wind + color

Now that the spring removal creates a more realistic cloth physics, I wanted to add another force to gravity - wind. I wanted to simulate wind blowing through the fabric, creating an undulating, gentle, constant motion. But I did not want the wind to blow at one consistent “speed” -- I wanted it to vary a bit, in a seemingly unpredictable way. Perlin noise could help with this. 

I brought in a “constant force behavior” from Toxiclibs and created an addWind() function that incorporated changes to the parameters of the constant force vector based on Perlin noise. 

Next, I wanted to add a similarly undulating change in color. As I looked at ways to use Perlin noise with color, I came across this tutorial from Gene Kogan that had exactly the kind of surreal effect I wanted. Here’s the implementation of everything up until now + wind and color:

https://editor.p5js.org/nkumar23/sketches/ugZc9Sry7

Adding sound

At this point I had a visualization that was pretty nice to look at and click on, but seemed like it could become even more satisfying with some feedback upon click-- maybe through sound! I added a piece of music I composed and a sound effect I made with Ableton Live -- the finishing touches. Check it out here -- the same as the sketch at the top.

https://editor.p5js.org/nkumar23/sketches/GoX7ueD-x

Next Steps

I would like to add some physical sensors to control parameters for this sketch — things like the way the wind blows, ways to stretch the fabric, rip it in the physical world, etc. I’m not wedded to using the muscle tension sensor anymore, though!

I’d also like to add more thoughtful sound interactions. Perhaps there are different interactions depending on when your rip the hole, where you rip it, how much of the fabric is left.

More broadly, this assignment made me want to explore physics libraries more. It is pretty impressive how nicely this cloth was modeled with Toxiclibs’ help; there’s a whole world of other physics library fun to be had.

Genetic Evolution Simulations and Athletic Performance

This week, we covered Genetic Evolution algorithms and surveyed a few approaches to designing simulations that implement this technique. Below, I’ll lay out a plan for a simulation in p5.js that takes inspiration from the improvement in athletic performance over the last 100+ years.

Scenario

Describe the scenario. What is the population? What is the environment? What is the "problem" or question? What is evolving? What are the goals?

When we watch athletes compete today, it is remarkable just how far they’re able to push the human body to achieve the feats they achieve during the games. Crowds at earlier athletic events were similarly mesmerized by the best athletes in the world during their eras. However, when we watch film of athletic competitions even 30-40 years ago, it often seems like we’re watching an amateur version of today’s sport. When we look at world record times for competitions like the 400m dash, we see a steady improvement over the years; most likely these are due to advances in technology, diet, strategy, training methods and other tools more readily available to modern athletes.

This steady march towards reaching an upper limit on athletic performance reminds me of a genetic evolution simulation. Thousands of athletes have tried to run around a track as fast as they could. Each generation of new athletes learns from the previous ones and finds little ways to improve. Over time, we see world records broken, little by little.

I would like to build a simulation that has objects try to “run” around a “track” as quickly as they can, under a number of constraints that loosely model those of real athletes. The viewer will be able to manually run each generation rather than having the simulation evolve as fast as possible, and we’ll record “world record” for the best individual “athlete” in that generation’s competition. We can display a record book on screen to see how the world records vary and eventually improve over time. We can also display the “stats” for the top n athletes to see how things like “strategy,” “technology,” and “muscle mass” change over time as the athletes improve. 

Phenotype and Genotype

What is the "thing" that is evolving? Describe it's phenotype (the "expression" of its virtual DNA) and describe how you encode its genotype (the data itself) into an array or some other data structure.

Athletes, represented by shapes on the screen, are the “things” that are evolving. The athletes will be physics objects that have a position, velocity and acceleration. They’ll also have other traits like “strategy” and “technology” that loosely model real world factors that can limit or increase their max speed and vary from generation to generation. Instead of thinking of technology/strategy as properties of the object, they could be thought of as forces that are applied to the object’s acceleration or velocity vector and vary from object to object in the system.

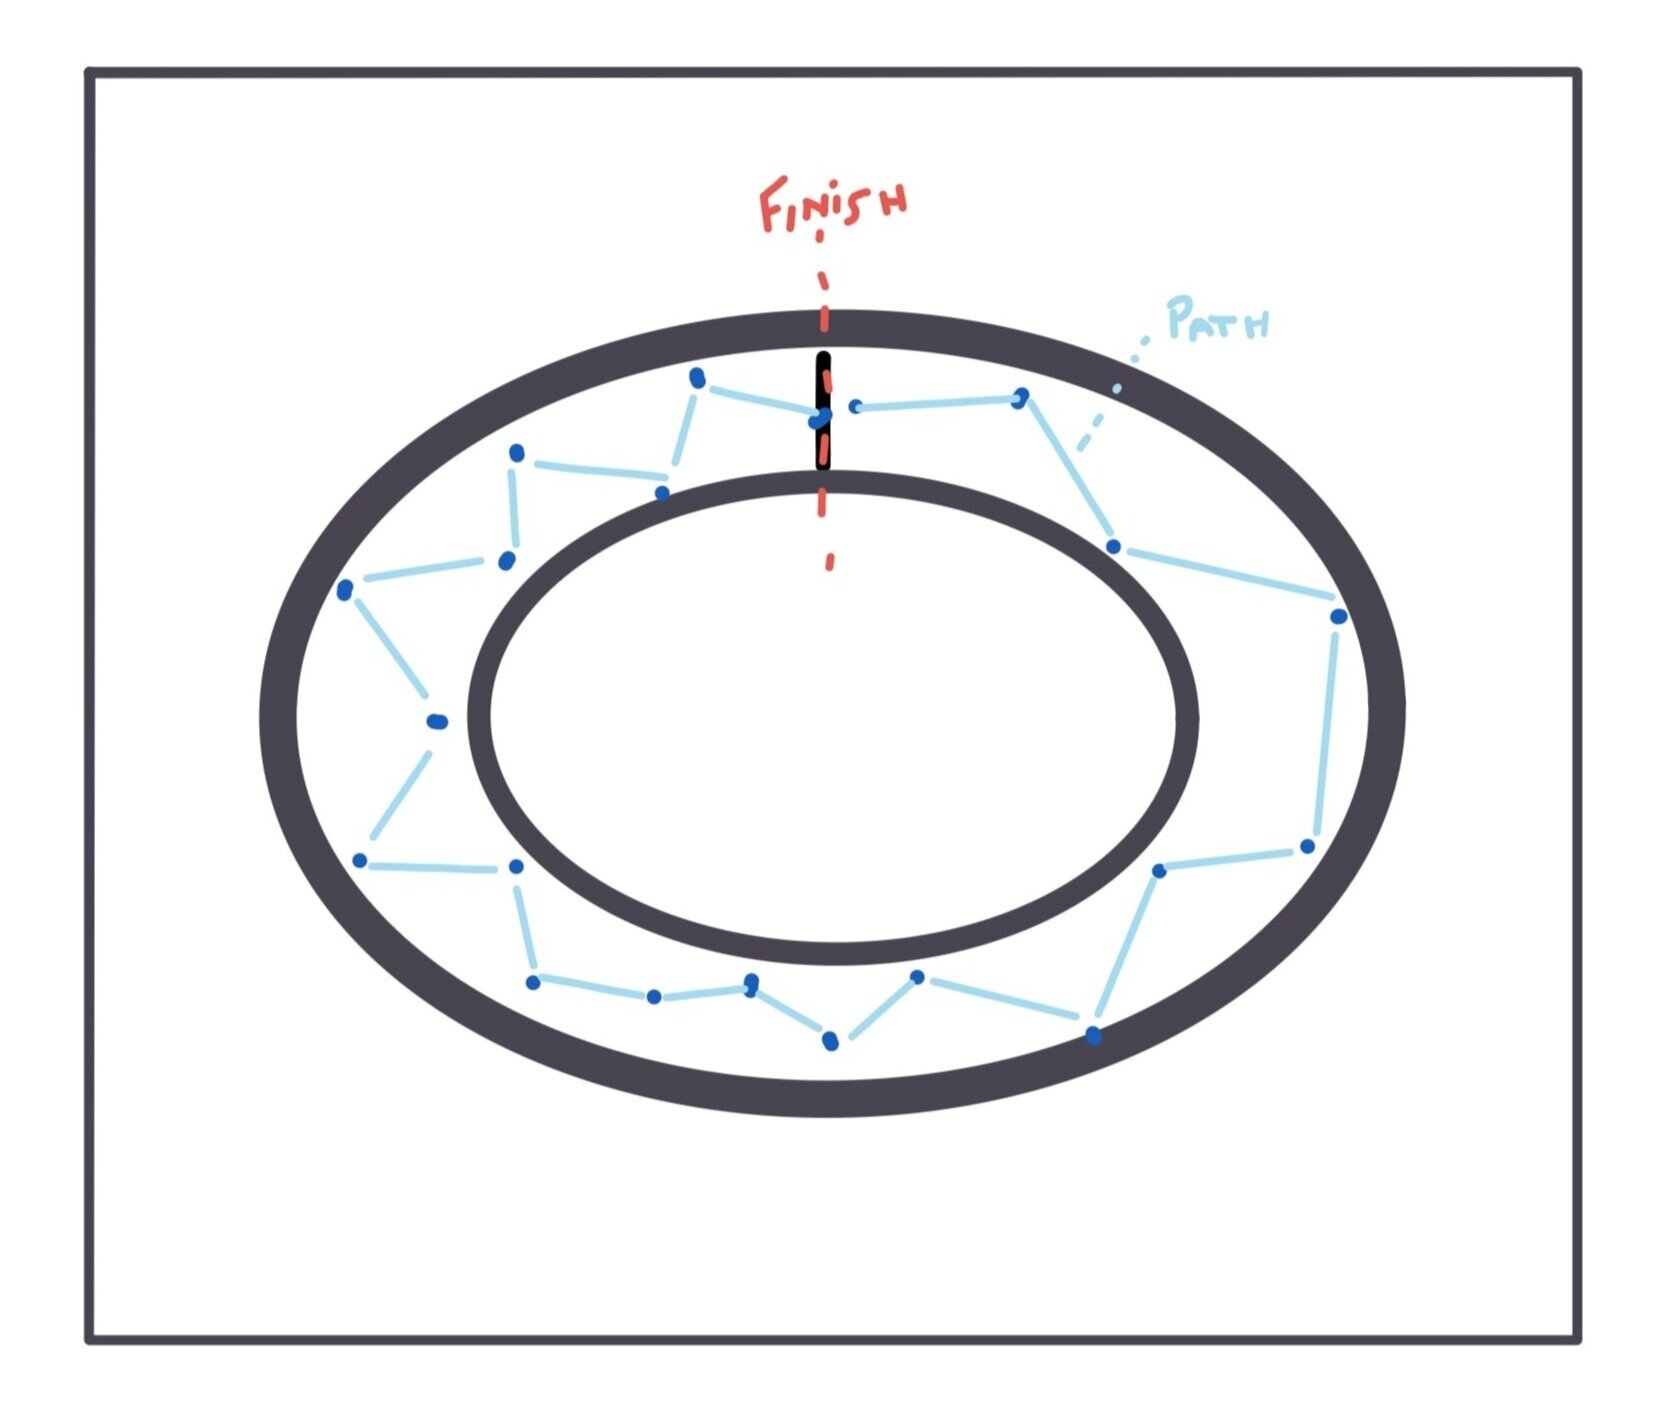
Strategy will control the efficiency of the path taken on the track. Each frame, the object will have to decide the angle of its trajectory. If the object zig-zags around the track, it will not be taking the most efficient route. Over time, the objects should learn to take the path with the least amount of wasted movements to get to the finish line. The code will need to be written in a way that the object only goes clockwise, rather than immediately going to the finish line to the objects’ left.

Genetic+evolution+algorithm+4.jpg
Genetic+evolution+algorithm+2.jpg
Genetic+evolution+algorithm+3.jpg

The objects will also have other constraints besides knowing the best route to run. They’ll a “technology” constraint — this will correspond to a max speed or max force property’s ceiling that applies to all athlete objects. Each athlete object’s specific technologies will allow it to reach a percentage of the ceiling — with some having “better” technology, or a higher chance of reaching the ceiling, and some will only reach, say, 50% of the ceiling, which means they will likely complete the race slower than athlete objects with better technology.

Athlete objects will also have different diets that behave similarly to technology. Diet could potentially control a “max force” constraint that affects acceleration, or could be a small velocity multiplication factor that works in conjunction with technology. This factor would apply to all objects, and each individual athlete object’s diet could vary to allow it to have a percentage of the max factor.

These properties encode the genotype and allow the athlete the potential to perform as well as their ceilings will allow them to perform. Over time, those ceilings will go up, which will allow individual athletes to go faster than the fastest in the previous generations.

The athletes’ phenotype, or expressed traits, will be their shapes and speeds of movement around the track. Perhaps diet can modulate size of the circle a bit and tech can change color or control some sort of blur effect.

Fitness Function

What is the fitness function? How do you score each element of the population?

Each generation, 20 athletes will compete. The fitness function will look for the elapsed time for the athlete to reach the finish line. Assume an oval track where the athletes begin at the top of the canvas and run clockwise as shown above. The pseudo-code to calculate the fitness function will be something like:

If athlete.pos.x equals finish.pos.x and  athlete.pos.y is between a range of finish.pos.y, trigger a function that will log the time elapsed since the start of the race and the point at which the if conditions are met..

Mutation and Crossover

Are there any special considerations to mutation and crossover to consider or would the standard approaches work?

Technology and diet ceilings should probably increase on some set interval -- maybe determined by user but set at a default of every 10 generations (like a decade). Crossover can continue in a standard way and so can mutation.

Particle Systems -- work in progress

Assignment: Build a particle system

Idea

This week, I wanted to make a system of blobs that looked like bacteria moving around the screen. I envisioned a mix of different bacteria with a bunch of common characteristics, but different colors and perhaps shapes or other features. I wanted to use the “extend” functionality of JavaScript to work with inheritance and give these different bacteria unique differences.

To do this, I started by modifying Shiffman’s Coding Challenge to create a blob with bacteria-like qualities, using things like p5 Vectors to get it ready for object-izing. Code here

I knew I would need to create a blob class that I called “Blobject,” which would have its aesthetic characteristics in a “display ()” function and other characteristics, like its ability to update/move, in other functions.

I also knew that I would need to pay special attention to where the blobject started on the screen, likely through its Vertex coordinates.

Finally, I would need to extend the Blobject to create another object (I called it a “Bluebject”) that could get added to the sketch from a “Blobject System” object.

Along the way, however, I got tripped up trying to make all of these things happen. I started with existing code examples and began modifying — but I may have been better off trying to write functions from the ground up, as I think I spent more time trying to backwards engineer code that wasn’t perfectly suited for my use case.

I feel like I’m close, but I have to cut myself off right now for the sake of not staying up all night. In my eventual- particle system sketch, I have this:

I need a bit more time to finish debugging, but I’m going to make it happen!

Fun with Polar Roses

Overview

I set out this week to explore using springs and forces + step up my object-oriented programming game. I ended up doing neither thing. Instead, I started making roses with polar coordinates and wound up getting sucked in to a game of “what does this do?” In the process, I wound up tinkering my way to a better understanding of the relationship between polar and cartesian coordinates + got a better sense of how some interesting visuals that could be incorporated into audiovisual performance can be created.

Final Code 1

The Futility of Attraction (Plenty of Fish)

Assignment:

Use concepts related to vectors and forces to create a sketch with a basic physics engine.

Idea Summary:

Sometimes the harder you try, the harder it is to find love! In this Valentine’s Day sketch, you are the circle at the center of the sketch and are trying to “find love” by intersecting with another circle and staying with it over time. However, the longer you try to stay with the companion circle, the more it will try to get away! Sad. There are, however, always more fish…erh, ellipses… in the sea… sketch… whatever.

Background and Process:

I used Shiffman’s sketch about “attraction with many movers” as the model for my sketch. My goal for the week was to successfully deconstruct this sketch and get a good understanding of how velocity, acceleration and forces work with vectors. I also wanted to shake off the rust and make sure I could implement collision detection and edge checking.

I’ll skip over the tales of failed relationships that left me momentarily jaded while creating the sketch :P Don’t worry— my optimism tank refills quickly!

While de/re-constructing the sketch, there were a few simple takeaways.

  • To implement edge checking, I needed to change both the x and y position and also the x and y velocities; this is the equivalent of changing x,y, and speed when recalling our nomenclature in ICM.

  • To flip attraction to repulsion, I needed to flip the sign of the force’s strength

  • To do collision detection, I wanted to check to see moments when the combined radii of the attractor and mover were equal. I realized after some unsuccessful attempts that I needed to shift to checking an inequality since floats are rarely exactly equal.

  • To make the acceleration of repulsion faster, I made the range of the constrain function narrower.

Random Dancer

Assignment: Using the random walker as a model, develop a program that experiments with motion. 

Code Example from Pic 1: Gaussian Distribution

Code Example from Pic 2: Gaussian Walker

Process:

I set out this week to explore probability distributions in the context of random walkers. My hope was to create a visualization that allowed participants (not saying users!) to select between a number of real life scenarios that followed common probability distributions (normal, binomial, logarithmic, etc); those probability distributions would inform the behavior of the walker.

Alas, the first week of school and the crazy waitinglist game (and the homework that comes with being in so many classes at once) derailed my ambition. Instead, I learned about how to implement the randomGaussian() function and watched videos about custom probability distributions.

I began by trying to drawing a normal distribution. I managed to get something working here. This isn’t quite a histogram; instead I tied the y position of the ellipse to the conditional statement related to each band of the probability distribution. As a result, this drawing will keep going beyond the canvas, and as a result, after a while the proportions between each band of the distribution become unclear. It’s not the most accurate/efficient implementation, but it confirmed that I was using the Gaussian function correctly.

Screen Shot 2020-02-03 at 11.48.43 PM.png

Next, I brought the randomGaussian() function back into the random walker example to inform the step behavior of the walker. Initially, I gave each band of the distribution a different color and different sized step, which made a marginally more interesting version of the Levy flight example presented in course materials. I played with different parameters — fill, colors, magnitude of steps— before landing on one that added something that caught my eye. I tried flipping the pos.x and pos.y variables. I now had an ellipse being drawn at (pos.x,pos.y) at the beginning of each loop and having another drawn at (pos.y,pos.x) when a condition was met. The result was an interesting mirror-image quality to the sketch. In the screenshot below, the image looks a bit like a dancing woman. In other iterations, it’s created something akin to a brain scan. All of them make me think of anti-matter being created in the universe…

Screen Shot 2020-02-03 at 11.54.44 PM.png

Next week I would like to get started on the assignment earlier. I think the best work at the early stages of learning something new comes from making mistakes, interrogating them, adjusting, getting lucky, understanding why, then moving forward with more intention and repeating the cycle. That takes time, and there is a hard limit to the amount of creativity I can imbue into my projects if I only have a day or two!