Traceroute

See here for the Traceroute assignment

The concept of a traceroute was entirely new to me prior to this course. I suppose I knew that when I searched for “espn.com” in my browser that my request would be routed through a number of intermediaries. I didn’t, however, spend much time thinking about the physical and digital entities along those hops, nor did I know that we had the power in our terminals to begin analyzing the physical geography of our own internet behavior via the traceroute command.

I chose to see what a path to “espn.com” looks like from my home device and from NYU. I’ve been going to espn.com since I think the website started; I was a religious Sportscenter viewer as a child, and still have a daily habit of checking the sports headlines. If only I had captured a traceroute from 1995-era espn.com up until now -- it would have been even more fascinating to see how things have changed!

NYU -> ESPN

My search from NYU to ESPN had 22 hops, with 6 of the stops returning a ***. The first 13 stops had NYU or .edu domains.

1  10.18.0.2 (10.18.0.2)  2.993 ms  2.020 ms  2.111 ms

 2  coregwd-te7-8-vl901-wlangwc-7e12.net.nyu.edu (10.254.8.44)  23.613 ms  11.542 ms  4.040 ms

 3  nyugwa-vl902.net.nyu.edu (128.122.1.36)  2.477 ms  2.274 ms  2.618 ms

 4  ngfw-palo-vl1500.net.nyu.edu (192.168.184.228)  3.235 ms  2.935 ms  2.744 ms

 5  nyugwa-outside-ngfw-vl3080.net.nyu.edu (128.122.254.114)  17.543 ms  2.714 ms  2.862 ms

 6  nyunata-vl1000.net.nyu.edu (192.168.184.221)  3.050 ms  3.094 ms  2.833 ms

 7  nyugwa-vl1001.net.nyu.edu (192.76.177.202)  3.047 ms  3.383 ms  2.922 ms

 8  dmzgwa-ptp-nyugwa-vl3081.net.nyu.edu (128.122.254.109)  3.584 ms  3.769 ms  3.484 ms

 9  extgwa-te0-0-0.net.nyu.edu (128.122.254.64)  3.545 ms  3.299 ms  3.292 ms

10  nyc-9208-nyu.nysernet.net (199.109.5.5)  4.031 ms  4.078 ms  3.842 ms

11  i2-newy-nyc-9208.nysernet.net (199.109.5.2)  4.124 ms  3.686 ms  3.505 ms

12  ae-3.4079.rtsw.wash.net.internet2.edu (162.252.70.138)  8.970 ms  9.097 ms  9.792 ms

13  ae-0.4079.rtsw2.ashb.net.internet2.edu (162.252.70.137)  9.741 ms  9.272 ms  9.777 ms

Once leaving the NYU space, the first IP address in Virginia is associated with Amazon.com -- presumably one of the AWS servers.

14  99.82.179.34 (99.82.179.34)  13.231 ms  10.645 ms  9.469 ms
15  * * *

The next 3 are also associated with Amazon, this time in Seattle: 

16  52.93.40.229 (52.93.40.229)  10.573 ms
    52.93.40.233 (52.93.40.233)  9.719 ms
    52.93.40.229 (52.93.40.229)  9.397 ms


Before a number of obfuscated hops and the end CDN.

17  * * *
18  * * *
19  * * *
20  * * *
21  * * *
22  server-13-249-40-8.iad89.r.cloudfront.net (13.249.40.8)  9.340 ms  9.164 ms  9.258 ms

I used the traceroute-mapper tool to visualize these hops, but it looks like their data doesn’t quite match the data I found with https://www.ip2location.com/demo; there is no Seattle in sight on the traceroute-mapper rendering! Who should we believe here?

Screen Shot 2020-09-28 at 7.34.10 PM.png

Home -> ESPN

I live in Manhattan, so I am not very physically far from the ITP floor. However, my home network and the NYU network would be expected to have pretty different hoops to jump through, so to speak, to get to the end destination. That, in fact, proved true with the traceroute. 

This route had 29 stops, with 12 stops returning ***. The first IP address is owned by Honest Networks, my internet provider. This is my IP address.

1  router.lan (192.168.88.1)  5.092 ms  2.481 ms  2.140 ms

2  38.105.253.97 (38.105.253.97)  4.323 ms  2.554 ms  3.187 ms

The next 3 are all private IP LANs -- I’m guessing these are also associated with my local device.

 3  10.0.64.83 (10.0.64.83)  2.247 ms  2.302 ms  2.181 ms
 4  10.0.64.10 (10.0.64.10)  3.127 ms  3.857 ms  3.588 ms
 5  10.0.64.0 (10.0.64.0)  3.653 ms
    10.0.64.2 (10.0.64.2)  2.214 ms  3.188 ms

The next IP address is associated with PSI-Net in Washington, DC, which appears to be a tier-1 optical provider. My guess is that Honest piggybacks off of this network, which seems to be larger and a legacy company now owned by Cogent.

 6  38.30.24.81 (38.30.24.81)  2.673 ms  2.573 ms  2.061 ms

Then we see a whole lot of cogentco - owned domains, followed by IP addresses in hop 10 that are both associated again with PSInet.

 7  te0-3-0-31.rcr24.jfk01.atlas.cogentco.com (154.24.14.253)  2.053 ms  2.771 ms
    te0-3-0-31.rcr23.jfk01.atlas.cogentco.com (154.24.2.213)  2.712 ms
 8  be2897.ccr42.jfk02.atlas.cogentco.com (154.54.84.213)  2.846 ms
    be2896.ccr41.jfk02.atlas.cogentco.com (154.54.84.201)  2.280 ms  3.010 ms
 9  be2271.rcr21.ewr01.atlas.cogentco.com (154.54.83.166)  3.106 ms
    be3495.ccr31.jfk10.atlas.cogentco.com (66.28.4.182)  3.281 ms
    be3496.ccr31.jfk10.atlas.cogentco.com (154.54.0.142)  3.611 ms
10  38.140.107.42 (38.140.107.42)  3.374 ms  3.468 ms
    38.142.212.10 (38.142.212.10)  3.910 ms

We’re finally to the AWS IP addresses now for the remainder of the hops, both in Virginia and Seattle. Given how many hops there are and how prevalent AWS is for so many hosted sites, it’s hard to draw conclusions about what companies/services  these hops might correspond to. But I suppose it’s another indication of just how dominant AWS is.

11  52.93.59.90 (52.93.59.90)  6.790 ms
    52.93.59.26 (52.93.59.26)  4.047 ms
    52.93.31.59 (52.93.31.59)  3.876 ms
12  52.93.4.8 (52.93.4.8)  3.708 ms
    52.93.59.115 (52.93.59.115)  11.582 ms  6.948 ms
13  * * 150.222.241.31 (150.222.241.31)  3.954 ms
14  * * 52.93.128.175 (52.93.128.175)  3.131 ms
15  * * *
16  * * *
17  * * *
18  * * *
19  * * *
20  * * *
21  * * *
22  * * *
23  * * 150.222.137.1 (150.222.137.1)  3.128 ms
24  150.222.137.7 (150.222.137.7)  2.671 ms
    150.222.137.1 (150.222.137.1)  3.558 ms
    150.222.137.7 (150.222.137.7)  2.685 ms
25  * * *
26  * * *
27  * * *
28  * * *
29  * server-13-225-229-96.jfk51.r.cloudfront.net (13.225.229.96)  3.178 ms  3.992 ms
Screen Shot 2020-09-28 at 7.42.38 PM.png

Conclusion

It really would be fascinating to see how the geographical paths of a website visit has changed over the last 25 years, when I began using the internet. A cursory search for tools or research that looked into this wasn’t fruitful, although I’m sure I could look harder and find something related. However, if you know of something along these lines, I’d love to see it!

My own analysis of my visits to espn.com, while not leading to any major revelations, put the idea of physical networks front and center in my mind, In combination with our virtual field trip, I feel like I have a much more tangible understanding of the physical infrastructure of the web than I did just a few weeks ago.

Tearable Dreams

Sketch: https://editor.p5js.org/nkumar23/sketches/GoX7ueD-x

Github: https://github.com/nkumar23/tearcloth2D

Original Plans

I originally entered this final hoping to create a sketch that visualized the quality of my sleep and was controlled by a muscle tension sensor I had already built. I wanted to visualize the entirety of my night’s sleep as a continuous fabric slowly undulating, with holes ripped through it when I clenched my jaw -- detected by the sensor.

I drafted up an initial roadmap that looked like this at a high level (sparing you the detailed steps I created for myself):

  1. Create the fabric using ToxicLibs and p5

    1. Adding forces and texture ripping to Shiffman’s example

      1. Start with mouse/key interactions for rip and forces (like wind/gravity)

  2. Create a clenched/not-clenched classification model

    1. Collect and label sensor data for training

      1. Create simple interface in p5 to record clench/not-clenched with timestamp so that I can label sensor values

      2. Train ml5 neural net using labeled data

  3. Link fabric ripping to sensor data

  4. Run this in real time and capture video of animation during sleep

I headed into this project knowing that I’d most likely tackle chunks 1 and pieces of chunk 2, but likely not the entire thing. Along the way, I wound up focusing entirely on the cloth simulation and abandoned the rest of the project for the time being. I added some audio interaction to round out this project in a way that I thought was satisfying. 

I’ll describe the process behind building this cloth simulation, and what the next steps could look like from here.

Inspiration

As difficult as dreams are to remember, I have short, vivid memories of an undulating surface, slowly changing colors, that at times looks like a grid from the matrix, and at other times looks filled in. As I began thinking of how I might want to visualize my sleep, I went immediately to this sort of flowing fabric-like image.

Luckily, as always seems to be the case, there is a Shiffman example for cloth simulation! I also found this example of a tearable cloth in native Javascript.

Process

I started with Shiffman’s 2D cloth with gravity example. He did the legwork of importing the Toxiclibs library and aliasing some important components, like the gravity behavior.

Rip detection

From that starting point, I first wanted to figure out how to rip the cloth. To begin, I calculated the distance between a clicked mouse and a particle and console logged the particle coordinates when the distance was less than 10 (i.e. which particle was clicked?).

https://editor.p5js.org/nkumar23/sketches/4NsLvcVlO

Rip detection, but make it visual

Next, I wanted to see if these particles were where I expected them to be, and nowhere else. To do this, I displayed the particles rather than the springs and made them change color upon click.

https://editor.p5js.org/nkumar23/sketches/cz2XdRYfH

Spring removal

Then, I wanted to remove springs upon click -- which would “tear” the cloth. To do this, I had to add a reference to the spring within the particle class so that specific springs could be identified upon click.

I spliced spring connections and decided to stop displaying the spring upon click, which led to this aesthetic:

https://editor.p5js.org/nkumar23/sketches/-dtg2SCCy

That doesn’t really look like a cloth was torn! Where’s the fraying? This behavior happened because the springs were not removed from the physics environment-- they were just no longer displayed. 

Removing the springs required adding a bit more logic. Instead of adding springs in the draw loop, we now have the framework for adding/removing springs within the Spring class’ logic. 

In the draw loop, we check whether a spring is essentially marked for removal upon click and remove it via the remove() function created in the Spring class. Thanks Shiffman for the help with that logic! 

https://editor.p5js.org/nkumar23/sketches/uykP2GyE2

Adding wind + color

Now that the spring removal creates a more realistic cloth physics, I wanted to add another force to gravity - wind. I wanted to simulate wind blowing through the fabric, creating an undulating, gentle, constant motion. But I did not want the wind to blow at one consistent “speed” -- I wanted it to vary a bit, in a seemingly unpredictable way. Perlin noise could help with this. 

I brought in a “constant force behavior” from Toxiclibs and created an addWind() function that incorporated changes to the parameters of the constant force vector based on Perlin noise. 

Next, I wanted to add a similarly undulating change in color. As I looked at ways to use Perlin noise with color, I came across this tutorial from Gene Kogan that had exactly the kind of surreal effect I wanted. Here’s the implementation of everything up until now + wind and color:

https://editor.p5js.org/nkumar23/sketches/ugZc9Sry7

Adding sound

At this point I had a visualization that was pretty nice to look at and click on, but seemed like it could become even more satisfying with some feedback upon click-- maybe through sound! I added a piece of music I composed and a sound effect I made with Ableton Live -- the finishing touches. Check it out here -- the same as the sketch at the top.

https://editor.p5js.org/nkumar23/sketches/GoX7ueD-x

Next Steps

I would like to add some physical sensors to control parameters for this sketch — things like the way the wind blows, ways to stretch the fabric, rip it in the physical world, etc. I’m not wedded to using the muscle tension sensor anymore, though!

I’d also like to add more thoughtful sound interactions. Perhaps there are different interactions depending on when your rip the hole, where you rip it, how much of the fabric is left.

More broadly, this assignment made me want to explore physics libraries more. It is pretty impressive how nicely this cloth was modeled with Toxiclibs’ help; there’s a whole world of other physics library fun to be had.

Genetic Evolution Simulations and Athletic Performance

This week, we covered Genetic Evolution algorithms and surveyed a few approaches to designing simulations that implement this technique. Below, I’ll lay out a plan for a simulation in p5.js that takes inspiration from the improvement in athletic performance over the last 100+ years.

Scenario

Describe the scenario. What is the population? What is the environment? What is the "problem" or question? What is evolving? What are the goals?

When we watch athletes compete today, it is remarkable just how far they’re able to push the human body to achieve the feats they achieve during the games. Crowds at earlier athletic events were similarly mesmerized by the best athletes in the world during their eras. However, when we watch film of athletic competitions even 30-40 years ago, it often seems like we’re watching an amateur version of today’s sport. When we look at world record times for competitions like the 400m dash, we see a steady improvement over the years; most likely these are due to advances in technology, diet, strategy, training methods and other tools more readily available to modern athletes.

This steady march towards reaching an upper limit on athletic performance reminds me of a genetic evolution simulation. Thousands of athletes have tried to run around a track as fast as they could. Each generation of new athletes learns from the previous ones and finds little ways to improve. Over time, we see world records broken, little by little.

I would like to build a simulation that has objects try to “run” around a “track” as quickly as they can, under a number of constraints that loosely model those of real athletes. The viewer will be able to manually run each generation rather than having the simulation evolve as fast as possible, and we’ll record “world record” for the best individual “athlete” in that generation’s competition. We can display a record book on screen to see how the world records vary and eventually improve over time. We can also display the “stats” for the top n athletes to see how things like “strategy,” “technology,” and “muscle mass” change over time as the athletes improve. 

Phenotype and Genotype

What is the "thing" that is evolving? Describe it's phenotype (the "expression" of its virtual DNA) and describe how you encode its genotype (the data itself) into an array or some other data structure.

Athletes, represented by shapes on the screen, are the “things” that are evolving. The athletes will be physics objects that have a position, velocity and acceleration. They’ll also have other traits like “strategy” and “technology” that loosely model real world factors that can limit or increase their max speed and vary from generation to generation. Instead of thinking of technology/strategy as properties of the object, they could be thought of as forces that are applied to the object’s acceleration or velocity vector and vary from object to object in the system.

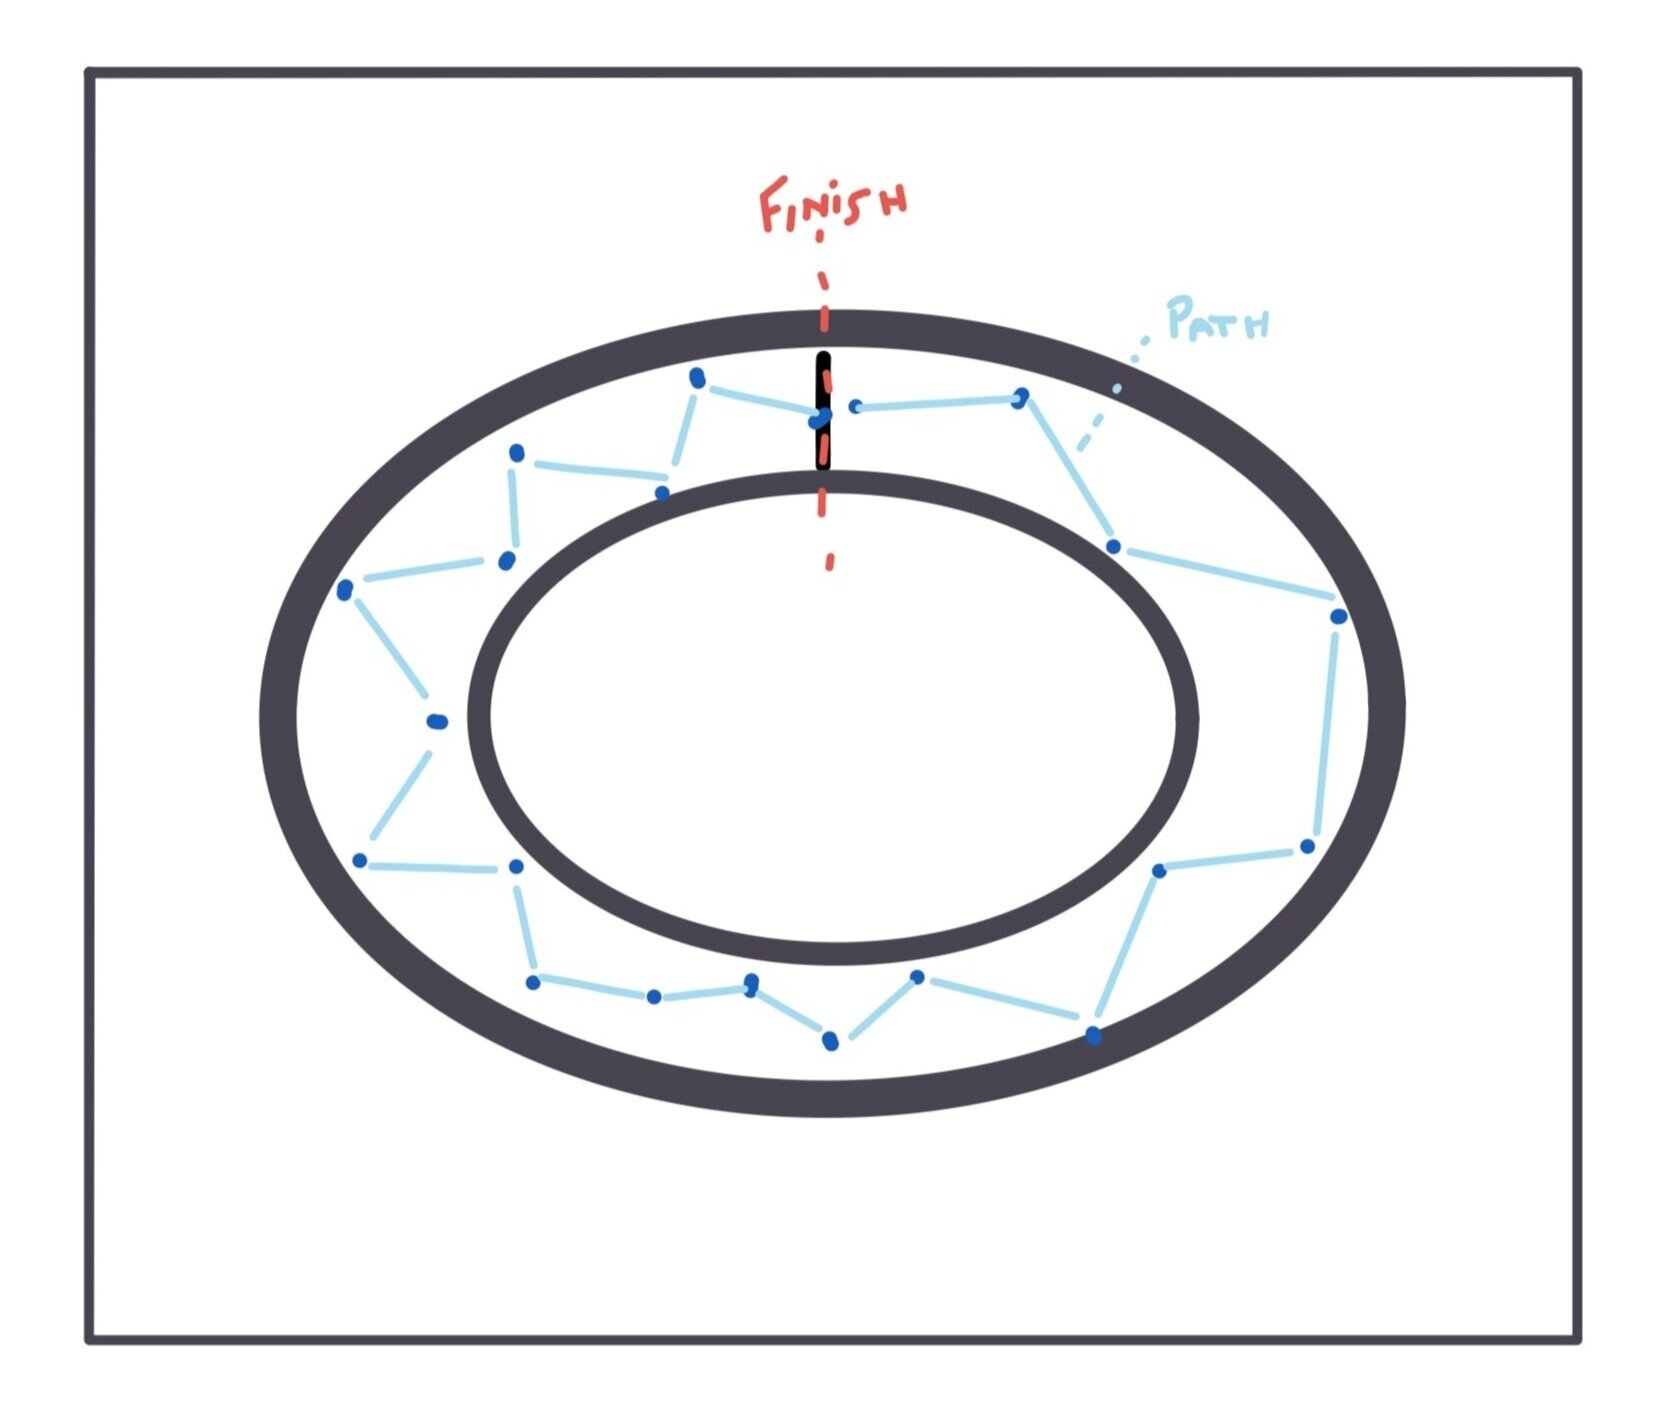
Strategy will control the efficiency of the path taken on the track. Each frame, the object will have to decide the angle of its trajectory. If the object zig-zags around the track, it will not be taking the most efficient route. Over time, the objects should learn to take the path with the least amount of wasted movements to get to the finish line. The code will need to be written in a way that the object only goes clockwise, rather than immediately going to the finish line to the objects’ left.

Genetic+evolution+algorithm+4.jpg
Genetic+evolution+algorithm+2.jpg
Genetic+evolution+algorithm+3.jpg

The objects will also have other constraints besides knowing the best route to run. They’ll a “technology” constraint — this will correspond to a max speed or max force property’s ceiling that applies to all athlete objects. Each athlete object’s specific technologies will allow it to reach a percentage of the ceiling — with some having “better” technology, or a higher chance of reaching the ceiling, and some will only reach, say, 50% of the ceiling, which means they will likely complete the race slower than athlete objects with better technology.

Athlete objects will also have different diets that behave similarly to technology. Diet could potentially control a “max force” constraint that affects acceleration, or could be a small velocity multiplication factor that works in conjunction with technology. This factor would apply to all objects, and each individual athlete object’s diet could vary to allow it to have a percentage of the max factor.

These properties encode the genotype and allow the athlete the potential to perform as well as their ceilings will allow them to perform. Over time, those ceilings will go up, which will allow individual athletes to go faster than the fastest in the previous generations.

The athletes’ phenotype, or expressed traits, will be their shapes and speeds of movement around the track. Perhaps diet can modulate size of the circle a bit and tech can change color or control some sort of blur effect.

Fitness Function

What is the fitness function? How do you score each element of the population?

Each generation, 20 athletes will compete. The fitness function will look for the elapsed time for the athlete to reach the finish line. Assume an oval track where the athletes begin at the top of the canvas and run clockwise as shown above. The pseudo-code to calculate the fitness function will be something like:

If athlete.pos.x equals finish.pos.x and  athlete.pos.y is between a range of finish.pos.y, trigger a function that will log the time elapsed since the start of the race and the point at which the if conditions are met..

Mutation and Crossover

Are there any special considerations to mutation and crossover to consider or would the standard approaches work?

Technology and diet ceilings should probably increase on some set interval -- maybe determined by user but set at a default of every 10 generations (like a decade). Crossover can continue in a standard way and so can mutation.

Sound in... My Apartment: Plans for a Quad experiment

The last couple of weeks have been truly bizarre. I was in college in 2008 during the Financial Crisis and thought it was one of the weirder and more momentous experiences I’d lived through. This moment has quickly leapfrogged 2008, and given how terrible this situation is for so many people, I’m very lucky to be in school yet again to participate in/observe how this all unfolds.

Still, it’s been difficult to focus on schoolwork during this first wave of changes to our lives, our world. Prior to going remote, I was very excited to experiment with a quad setup at school; moving from stereo to multichannel was what I signed up for! Going remote, worrying about family and friends, making major adjustments to lifestyle, and just reading the constantly shifting news has drained my motivation tank. So, this week’s assignment is basically a sketch, a set of plans for an experiment, but not what I would have liked to do in a more-normal world.

Idea:

I would like to make a p5 + tone.js sketch that functions like a spatialization test with a twist. I’ve never worked with quad, so this would be a helpful way to start to understand some of the “physics” of different audio setups. In short, the tool will play individual notes in the form of moving balls that, when played together, can form chords. The notes will play through different channels as they collide with the “speakers” on screen.

Here is a rough skeleton of the beginnings:

As I build this out, users will be able to:

  • Arrange a multi-channel speaker setup on the canvas

    • The speakers will be rectangles with inputs to indicate the channel number

  • Click to create notes visualized as balls that bounce around the screen

    • The balls carry a note that belongs to a particular key

    • The note is randomly chosen from the array of notes when created

      • Default will be to only choose 1,3,5,8 notes from the key to create a major chord

    • As the balls collide with the rectangles, the note associated with the ball plays through the channel associated with the speaker.

  • Create many balls, increasing the chance of a chord playing through different speakers

  • Use the the right or left arrow to change the key that the notes are drawn from.

  • Use the up or down arrows to make balls move faster or slower

  • Hit space to clear balls

Execution Plan

I started to wire up the sketch by creating objects for the balls and rectangles. I modified an earlier particle system sketch I made, and kept the system object, which may allow for some more features down the line. I haven’t connected tone yet, which is obviously the meat of this sketch. I plan on working on this over the next 2 weeks to make it work for the binaural assignment. The first set of things I need to to do:

  • Finish collision detection between ball and rectangle

  • Add tone.js to the html doc

  • Hard- assign channels to each speaker

    • Once this work, allow input to assign channel

  • When collision is detected, play a sound

    • Make sound draw from an array of possible sounds in a key

    • Create arrays for different keys

    • Allow key to be changed

  • Connect slider to ball speed

  • Re-configure keys/mouse presses to match a good UX

  • Create volume slider and hook up to tone

Particle Systems -- work in progress

Assignment: Build a particle system

Idea

This week, I wanted to make a system of blobs that looked like bacteria moving around the screen. I envisioned a mix of different bacteria with a bunch of common characteristics, but different colors and perhaps shapes or other features. I wanted to use the “extend” functionality of JavaScript to work with inheritance and give these different bacteria unique differences.

To do this, I started by modifying Shiffman’s Coding Challenge to create a blob with bacteria-like qualities, using things like p5 Vectors to get it ready for object-izing. Code here

I knew I would need to create a blob class that I called “Blobject,” which would have its aesthetic characteristics in a “display ()” function and other characteristics, like its ability to update/move, in other functions.

I also knew that I would need to pay special attention to where the blobject started on the screen, likely through its Vertex coordinates.

Finally, I would need to extend the Blobject to create another object (I called it a “Bluebject”) that could get added to the sketch from a “Blobject System” object.

Along the way, however, I got tripped up trying to make all of these things happen. I started with existing code examples and began modifying — but I may have been better off trying to write functions from the ground up, as I think I spent more time trying to backwards engineer code that wasn’t perfectly suited for my use case.

I feel like I’m close, but I have to cut myself off right now for the sake of not staying up all night. In my eventual- particle system sketch, I have this:

I need a bit more time to finish debugging, but I’m going to make it happen!

Listening to Bio-Signal (Or: JAWZZZ)

Assignment: Expose a signal from some under-represented part of your body.

Idea

Our bodies produce signals that we can’t see, but often can feel in one dimension or another. Whether pain or restlessness, euphoria or hunger, our body has mechanisms for expressing the invisible.

Some of its signals, however, take time to manifest. Small amounts of muscle tension only convert into pain after crossing some threshold — which, in some cases, could take years to reach. I clench my teeth at night, which only became visible a few years ago when the enamel on my teeth showed significant wear and tear. At various times, I had unexplainable headaches or jaw lock; but for the most part, my overnight habits were invisible and not sense-able.

With technological prostheses, however, we can try to shift the speed at which we receive signal. This week, I built a muscle tension sensor to wear on my jaw while sleeping with the hope that I could sense whether I still clench my jaw. Long story short: I most likely do still clench my jaw, but without spending more time on statistical analysis of my results, it’s not wise to read too deeply into the results.

I’ll go over the process and results, but perhaps the most important reflection in this whole process is that even in my 3-day experiment, it was possible to see the possible pitfalls that accompany trying to quantify and infer meaning from data in situations that include even minimal amounts of complexity.

Process

This experiment required the following pieces:

  • Wire together a muscle tension sensor and microcontroller

  • Send data from the sensor to a computer

    • I used the MQTT protocol to wirelessly send data from my Arduino to a Mosquitto server

  • Write the data from the server to a database

    • I used a node.js script to listen to the MQTT data and write it to a local SQLite database on my computer

  • Analyze data from the database

[As a side note: prior to this assignment, I had not used a number of these different technologies, especially not in such an interconnected way. The technical challenge, and the opportunity to learn a number of useful skills while tackling these challenges, was a highlight of the week!]

I started by assembling the hardware and testing on my forearm to make sure it worked properly:

IMG_4615.jpeg

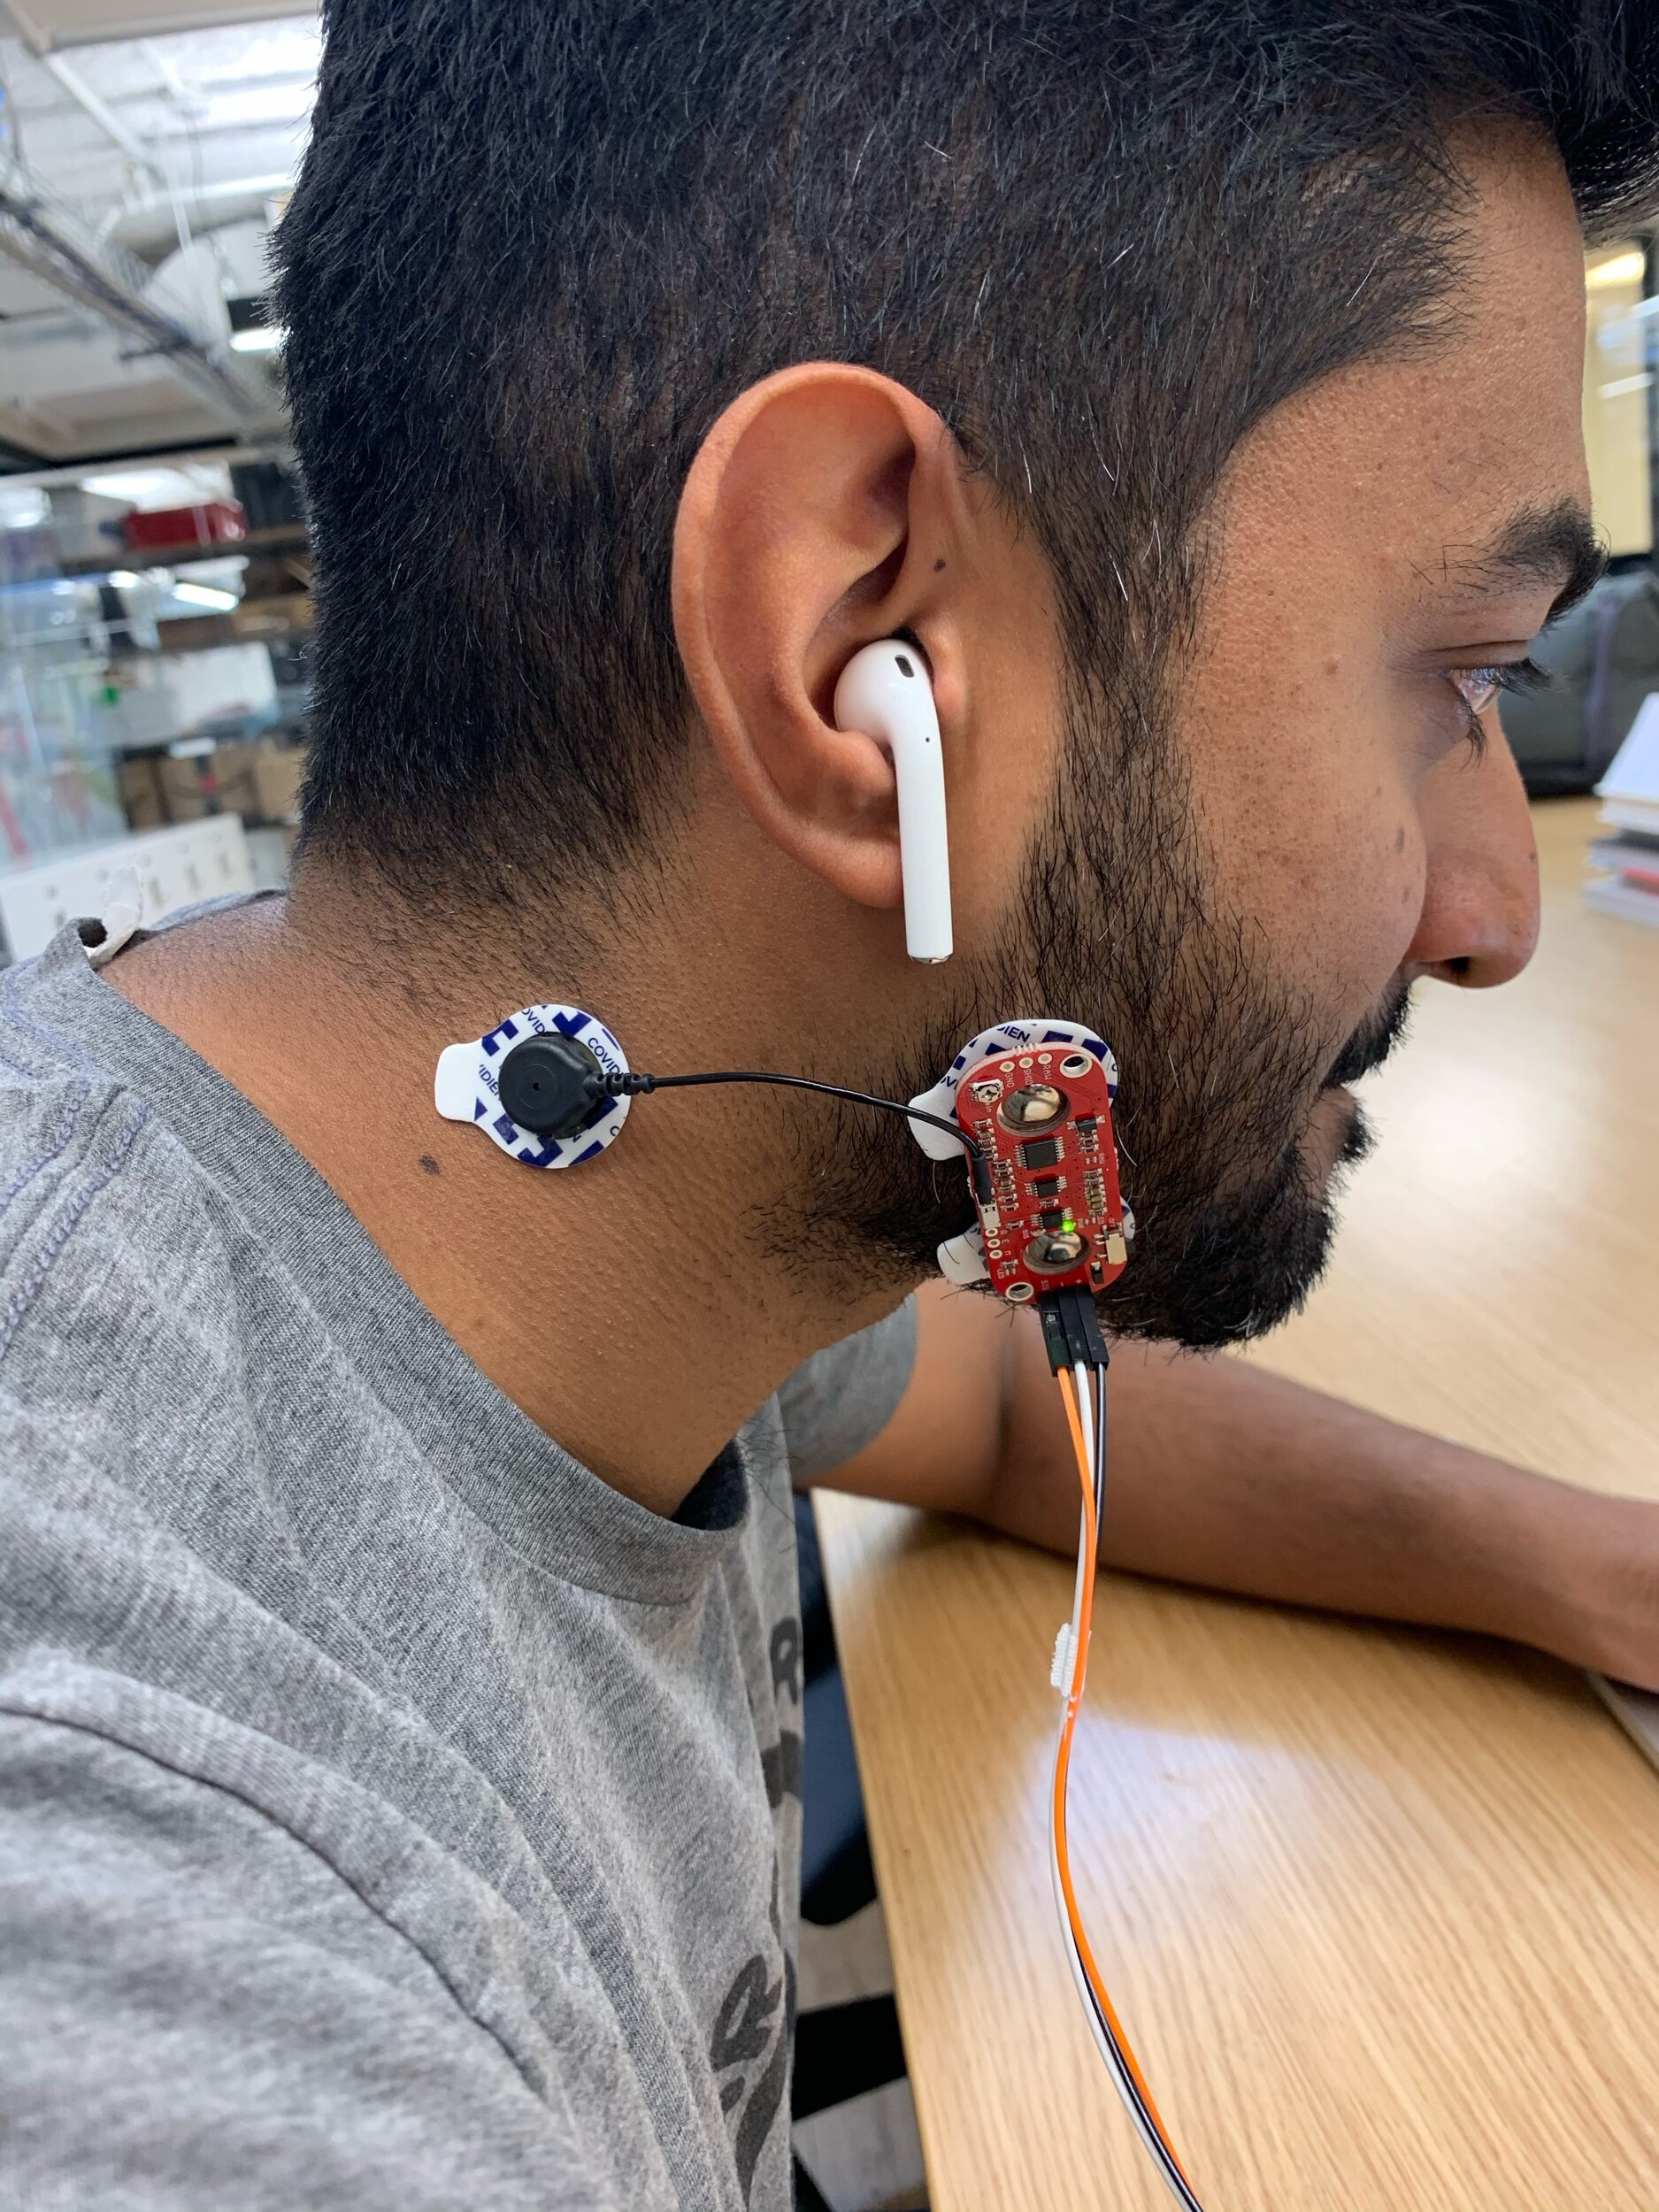
I then moved to testing that it could sense jaw clenching (it did):

IMG_4632.jpeg

Ultimately, I put it to the test at night. The first night I tried to use the sensor, my beard seemed to interfere with the electrodes too much. In true dedication to science, I shaved off my beard for the first time in years :P It seemed to do the trick:

Adjustments.jpeg

Results

OK, so— what happened?

First, the basics: This data was collected on Saturday night into Sunday morning for ~8 hours. I wore the sensor on my right jaw muscle and took 2 readings per second the entire time.

And a few caveats: this is only one night’s worth of data, so it is really not conclusive whatsoever. It’s really just a first set of thoughts, which can hopefully be refined with more data and Python know-how. I also did not capture film of my sleeping to crosscheck what seems to be happening in the data with what actually happened in real life.

With that said, here’s one explanation of what happened.

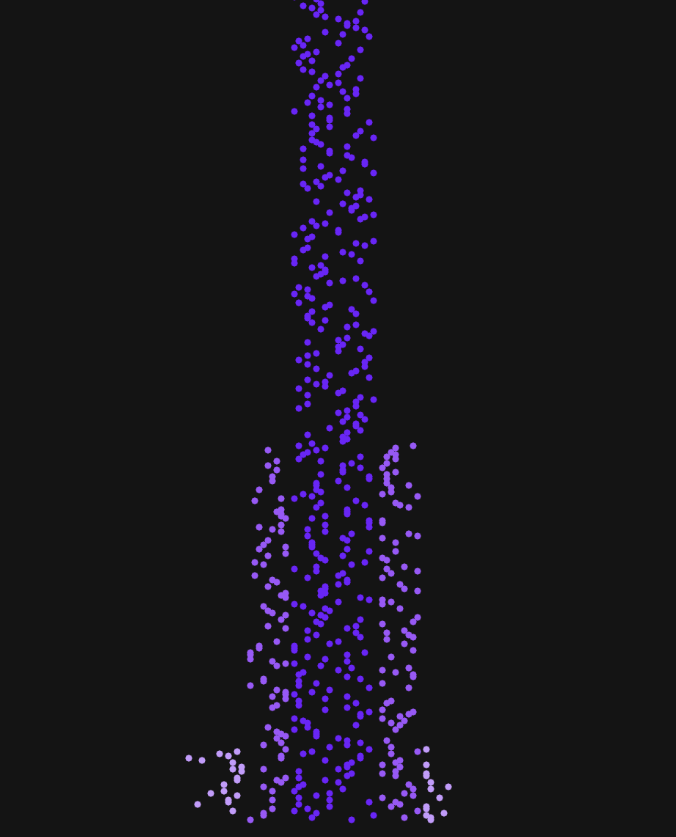
Throughout the night, it’s likely that I shifted positions 5-10 times in a way that affected the sensor. In the graph below, there are clusters of datapoints that appear like blue blocks. Those clusters are periods where the readings were fairly consistent, suggesting that I may have been sleeping in one consistent position. These clusters are usually followed by a surge in reading values, which happen when the sensor detects muscle tension, but also happened when I would touch the sensors with my hand to test calibration. When sleeping, it’s possible that I rolled over onto the sensor, triggering periods where the readings were consistently high.

annotated jaw analysis.png

During those fairly-stable periods, there are still a lot of outlying points. By zooming into one “stable” area, we can look at what’s happening with a bit more resolution:

Screen Shot 2020-02-23 at 6.36.50 PM.png

This is a snapshot of 1 minute. During the beginning of the snapshot, the sensor values are clustered right around a reading of 100. Then there is a gap in readings— the readings were higher than 400 and I didn’t adjust the y-axis scale for this screenshot— then they return to ~100 before spiking to 400. The finally begin returning to an equilibrium towards the end of the minute.

jaw analysis 2.png

This could be evidence of the jaw-clenching that I was looking for initially. It would be reasonable to expect jaw clenching to last only for a few seconds at a time, but that it could happen many times in a row. Perhaps this data shows this in action — I am sleeping normally, clench my jaw for a few seconds, relax again for 5 seconds, and then clench my jaw for another 5 seconds before letting up.

Ultimately, it looks like this sensor data may unveil 2 behaviors for the price of 1: shifts in sleeping position + jaw clenching!

Reflections

In order to make these insights somewhat reliable, I need to do a few things:

  • Collect more data

    • This is only one night’s worth of data. It’s possible that this is all noise, the sensor didn’t actually work at all, and I’m just projecting meaning onto meaningless data. A bigger sample size could help us see what patterns persist day after day.

  • Collect data from different people

    • In order to validate the hypothesis that high-level clusters explain shifts in position and more granular clusters/outliers show jaw clenching, I’d need to try this with other people. I know that I clench my jaw, but if someone who doesn’t clench still has similar patterns in data, I’d need to revisit these hypothesis.

  • Validate insights against reality

    • If I had video of my night, or if some house elf took notes while I slept, we could tag different actual behaviors and timestamps. Capturing shift in position should be relatively easy to do, as long as I get the lighting figured out. Clenching might be harder to capture on video.

  • Statistical analysis

    • I used the scatterplot to see obvious visual patterns. Using some clustering analysis, I could understand the relationships between clusters and outliers at a more detailed level.

Beyond what I could do to improve this analysis, I think there’s a bigger point to make: we should be skeptical of the quantified data we are presented with and ask hard questions about the ways in which the presenters of data arrived at their conclusions. In my experiment above, I could have made some bold claim about my sensor being able to detect sleep positions and TMJ-inducing behavior, but the reality is that the data needs a lot of validation before any insights can be made confidently. While academia has checks and balances (which themselves have a lot of issues), the rise of popular data science and statistics has not been coupled with robust fact-checking. So — before going along with quantified-self data, make sure to ask a lot of questions about what might be causing the results!

Thanks to Don Coleman and his course Device to Database — extremely helpful for this technical implementation of this project.

Fun with Polar Roses

Overview

I set out this week to explore using springs and forces + step up my object-oriented programming game. I ended up doing neither thing. Instead, I started making roses with polar coordinates and wound up getting sucked in to a game of “what does this do?” In the process, I wound up tinkering my way to a better understanding of the relationship between polar and cartesian coordinates + got a better sense of how some interesting visuals that could be incorporated into audiovisual performance can be created.

Final Code 1

The Futility of Attraction (Plenty of Fish)

Assignment:

Use concepts related to vectors and forces to create a sketch with a basic physics engine.

Idea Summary:

Sometimes the harder you try, the harder it is to find love! In this Valentine’s Day sketch, you are the circle at the center of the sketch and are trying to “find love” by intersecting with another circle and staying with it over time. However, the longer you try to stay with the companion circle, the more it will try to get away! Sad. There are, however, always more fish…erh, ellipses… in the sea… sketch… whatever.

Background and Process:

I used Shiffman’s sketch about “attraction with many movers” as the model for my sketch. My goal for the week was to successfully deconstruct this sketch and get a good understanding of how velocity, acceleration and forces work with vectors. I also wanted to shake off the rust and make sure I could implement collision detection and edge checking.

I’ll skip over the tales of failed relationships that left me momentarily jaded while creating the sketch :P Don’t worry— my optimism tank refills quickly!

While de/re-constructing the sketch, there were a few simple takeaways.

  • To implement edge checking, I needed to change both the x and y position and also the x and y velocities; this is the equivalent of changing x,y, and speed when recalling our nomenclature in ICM.

  • To flip attraction to repulsion, I needed to flip the sign of the force’s strength

  • To do collision detection, I wanted to check to see moments when the combined radii of the attractor and mover were equal. I realized after some unsuccessful attempts that I needed to shift to checking an inequality since floats are rarely exactly equal.

  • To make the acceleration of repulsion faster, I made the range of the constrain function narrower.

Random Dancer

Assignment: Using the random walker as a model, develop a program that experiments with motion. 

Code Example from Pic 1: Gaussian Distribution

Code Example from Pic 2: Gaussian Walker

Process:

I set out this week to explore probability distributions in the context of random walkers. My hope was to create a visualization that allowed participants (not saying users!) to select between a number of real life scenarios that followed common probability distributions (normal, binomial, logarithmic, etc); those probability distributions would inform the behavior of the walker.

Alas, the first week of school and the crazy waitinglist game (and the homework that comes with being in so many classes at once) derailed my ambition. Instead, I learned about how to implement the randomGaussian() function and watched videos about custom probability distributions.

I began by trying to drawing a normal distribution. I managed to get something working here. This isn’t quite a histogram; instead I tied the y position of the ellipse to the conditional statement related to each band of the probability distribution. As a result, this drawing will keep going beyond the canvas, and as a result, after a while the proportions between each band of the distribution become unclear. It’s not the most accurate/efficient implementation, but it confirmed that I was using the Gaussian function correctly.

Screen Shot 2020-02-03 at 11.48.43 PM.png

Next, I brought the randomGaussian() function back into the random walker example to inform the step behavior of the walker. Initially, I gave each band of the distribution a different color and different sized step, which made a marginally more interesting version of the Levy flight example presented in course materials. I played with different parameters — fill, colors, magnitude of steps— before landing on one that added something that caught my eye. I tried flipping the pos.x and pos.y variables. I now had an ellipse being drawn at (pos.x,pos.y) at the beginning of each loop and having another drawn at (pos.y,pos.x) when a condition was met. The result was an interesting mirror-image quality to the sketch. In the screenshot below, the image looks a bit like a dancing woman. In other iterations, it’s created something akin to a brain scan. All of them make me think of anti-matter being created in the universe…

Screen Shot 2020-02-03 at 11.54.44 PM.png

Next week I would like to get started on the assignment earlier. I think the best work at the early stages of learning something new comes from making mistakes, interrogating them, adjusting, getting lucky, understanding why, then moving forward with more intention and repeating the cycle. That takes time, and there is a hard limit to the amount of creativity I can imbue into my projects if I only have a day or two!

The A-Minor Music Machine

So that this doesn’t get buried under the reflections below, here’s the sketch. I will update here when the version that works with Arduino is functional.

——

Within 10 minutes of posting this, I’ll probably be editing code again. This project, more than any up to this point, drove me insane and made me so happy.

At various points in the week, I grunted out loud to myself (and anyone in my general vicinity) as I failed to notice a missing “this.”; I enlisted a former software developer colleague to hop on the phone and talk me through questions late at night when office hours were no longer an option; I thought I’d reached a nice stopping place, then thought of one more feature, then looked up and another hour went by.

And in the process, my empathy for all the devs I know just increased exponentially from an already- empathetic place.

With the preamble aside— what was the assignment? What did I make?

The assignment this week was to use objects, classes, arrays of objects, and interactions between objects. I hadn’t yet used sound in a p5 sketch, so I made that a constraint for myself— do all of the above while using sound.

I got inspiration for this sketch from this example; after looking at it I wanted to see if I could replicate the effect on 4 different drum sounds on one canvas. I started by trying to get it working without any objects/classes, which you can see here. It worked! From there, I started to see a “sound” object coming together— something that had a type for each type of drum sound (kick, snare, etc). It would also be able to display itself and maybe analyze its amplitude. Simple, right?

The process of migrating this code to an object-oriented structure took a lot longer than I’d expected, and was the source of a lot of the grunting and requests for help. Ultimately, there were a couple of important lessons:

  • Understand variable scoping:

    • Global variables can be used.. um… globally.

      • When using something like p5.Amplitude this was a really important concept to internalize. p5.Amplitude measures the entire output audio unless otherwise specified. If p5.Amplitude is set globally, it’s not possible to setInput later on and have that used to, say, draw rectangle height like I do.

    • this.object is available for all object instances in the class

    • instantiating a variable inside a function within a class scopes that variable to just be available in the function

      • know when to use this vs a this.object

  • While debugging, isolate each action you are trying to perform independent of other actions.

    • Do this by finding or creating variables to console log in order to see whether the program in functioning as expected

  • Keep simplifying

    • I found myself, and still find myself, repeating some code with only small variations for particular cases. Instead of having a bunch of if statements to describe when to play a sound and the same set of if statements describe when to analyze a sound, maybe there could be a common variable that could pass to both .play and .analyze (in this case, this.sound.)

Pieces

I recorded the drum sounds, chords and bass notes in Logic Pro X and exported each sound as an mp3. I loaded those into p5 and used preLoad to make them available to the rest of the sketch.

I used the p5.Amplitude, setInput, and getLevel functions to get the amplitude of any given sound file. I could then pass that amplitude reading (done in the draw function to get it continuously as the file is played) to the rectangle height parameter to create the drum visualizations. Those are triggered by keystrokes.

The chords are stored in an array. The right and left arrows cycle either up or down the array, resetting if they reach the end of the array. When they are created, they get passed a random number between 1 and 6. That number is used to change the background. A few of the numbers change the background color. Others don’t. The number assigned to an instance of an object is random, so there’s no rhyme or reason to when the background changes other than that it only happens when chords are played.

There are some white dots that appear occasionally. These are an array of “Item” objects that get triggered from within the display function. These appear when a particular random number in the chord object appears when a kick drum has been played. In order to make this happen, I created a state variable to measure whether the kick drum has been played (but resets after it gets played). When the kick (and clap, same logic) has played and the random number coincided, these ellipses appear until the condition is no longer true.

The bass notes trigger the triangular visualization in a similar way.

All in all this has been a really rewarding project to really ramp up my understanding of a number of things. As an added bonus, it is a great foundation for working with serial communication in PComp: the variables controlled by keystrokes will be controlled by buttons and other things out in the real world!

Loops and Hoops

This week our ICM assignment focused on using loops to make our code express more with less. I also used the image and preLoad functions to bring in outside images, something I had not yet done. In the process, I got to start building a better intuition for how the different pieces of loops and if statements interact with each other, although I got a bit fixated on the images in my animation and have plenty left to explore about the nature of loops.

Take a look at the sketch here

The NBA season is fast approaching and Rockets fans (me included) are starting to get excited about the new James Harden and Russell Westbrook pairing. I made a silly animation/interaction to have some fun while playing around with loops and animation.

I used For Loops to generate a matrix of Draymond Green defenders on one side of the court while I used the same approach to if statements and incrementing that we used to bounce balls around the screen to animate James Harden and Russel Westbrook images. To add a little interactivity, I used the mousePressed function to both create a toggle state to create conditional “screens” after mouse clicks and to create a click counter, which let me make one screen only trigger after a certain number of clicks.

In the future, I’d like to see how I could have looped over an array of images to create a team of different players to be the defenders instead of 4 Draymonds. I also more than likely got lucky that this program worked— too many variables are named x and y inside of functions without intentionally thinking about variable scoping.

On to objects and functions!

CollaboCoding in P5

Last week we began playing with variables, introduced conditional statements and for loops, and overall added more to our bag of tricks. Our homework asked us to use some of these tools to create buttons or sliders that controlled some other element on the screen (without using buttons that we get for free from the browser or bootstrap-like tools.)

But really, this week was about learning how to make our code organized and commented well enough for another human to understand. So, I’ll reflect a bit about what worked and didn’t work so well while collaborating with a partner.

Our Approach

We decided to start our sketches individually rather than agreeing on a design before we’d had time to process the week’s lessons. Each of us took a couple of days to mock up a sketch of our own, then traded over the weekend to review and add to our partners’ sketch. On Monday/Tuesday before class, we chatted about our changes in-person and helped each other understand our additions or changes to each others’ code.

Drafts

In my initial draft, my intent was to create a set of buttons that mapped to the basic parts of a sentence — subject, verb, adjective, noun — and changed each of those corresponding parts of a sentence with each button press. In order to do this, I knew I’d need to work with an array of strings and use some logic to randomly select from those arrays, then call the results of that logic in the rest of my code. I also knew that I’d need to use the mousePressed() or mouseClicked() functions with conditionals that mapped to each rectangular button.

As I began to figure out the word choice logic, I created variables with different pieces of the process; one variable to create a list of words, another to randomly select an index from that list, another to translate and store that index as an actual word. When I needed to wire that up to buttons, however, I realized that I’d either need— or drastically improve the efficiency of my code— with a function specifically for all of this logic. This took me away from animation, but ultimately was a rewarding process!

My partner created this very cool looking animation. Her goal was to have the background change to the roll-over color of each circle when pressed. However, there was initially some odd behavior that kept the background blue under certain conditions. I made it my goal to debug this issue and get her sketch working as she intended.

Collaboration

Once I got the code in my sketch working the way I wanted it to in a simple, very lightly styled interface, I focused on writing comments that would make the code immediately understandable for my partner, without needing to physically explain anything. For the most part, it worked— my partner was able to add a ton of animation and styling to the next iteration of the sketch. However, I failed to make clear why I created a “quarterW” and “quarterH” variable, so she ended up writing her on logic for rectangle sizing using the built-in width and height variables.

When we met face-to-face to talk through our results, we discovered an unintended behavior of the “frame” in her additions to my sketch, which we were able to debug together. While our comments helped us get 90% of the way, it was helpful to debug together. We were also able to discuss the changes to her sketch that debugged her initial vision (here). The solution was fairly straightforward to implement: at the very end of the code, the part that created toggles for on1, on2, and on3, we needed to ensure that if one button was on, the other 2 were off. By showing her how console logging the states of each “on” variable allowed me to see the unintended behavior in her initial sketch when multiple variables were on at the same time, we were able to quickly understand the roots of the bug.

Overall, the most useful part of this exercise was having to pay close attention to how our code was organized and commented, which will continue to be important as we start adding more and more to our toolkit!

Shoutout to Beste Saylar, my heretofore anonymous partner :)

For clarity: NK Draft, Beste revision // Beste Draft, NK revision

Variables!

Last week, I drew a sketch of a hiker climbing some mountains (vaguely resembling the Grand Tetons) around sunset. As the very first exercise with p5js, we were encouraged to keep everything hard-coded to get a better feel for how different value ranges would express themselves on the screen.

This week, however, we’re having fun with variables!

So- I took last week’s drawing and made it more interactive (click link here to see).

Just like what I imagine so many assignments will be like at ITP, there are a number of elements of this sketch that I would like to do differently, if I had some more time. Here are a few examples:

1) Switch which components the mouse controls

When I initially started the assignment, I knew how to move the sun and sunset color slices, but didn’t yet figure out how to move the hiker— which is really a collection of lines, rather than a single function like fill() or ellipse(). Fill() and ellipse() are easier to parameterize with variables. I wound up using translate() for the hiker after I’d already coded the interactivity with the sun and background. I knew I wanted some elements to move based on time and others to move with mouse interaction. The sun/background moving with time and hiker moving with user control would have made more sense… but this is art school, so let’s just say I meant this as an attempt to invert our relationship with time and the sun. To give the user control over one of the things normally entirely out of our control: time… or something like that :)

2) Make the hiker descend upon hitting the window width + reflect around the y-axis

Currently, the hiker glides backwards down the mountain a good handful of seconds after getting to the width of the window. I couldn’t see immediately why my incrementing structure doesn’t work; with a few more minutes (or hours) I think I can figure this out, but alas, I don’t have them right now. Console.log-ging the x variable shows that the x variable reaches ~430 when the figure appears to leave the window frame, reaches 600 (the current window width) a few seconds later, then starts the descent. The y-variable logs as a negative number the entire time, even though the incrementing function should only reverse the sign when x > width or x <0.

From an aesthetic perspective, it looks strange to see the hiker walk down the mountain backwards. I’d like to have it flip across its y-axis when it turns around, but I’m not quite sure how to do so yet.

While the sketch isn’t perfect, it has definitely given me clear questions that I’d like to learn the answer to. Perhaps the next topics will lead to some more efficient and effective approaches.

On to For loops!

Creating a Static Drawing in p5js

Assignment Prompt: Create your own screen drawing: self-portrait, alien, monster, etc. Use 2D primitive shapes – arc(), curve(), ellipse(), line(), point(), quad(), rect(), triangle() – and basic color functions – background(), colorMode(), fill(), noFill(), noStroke(), stroke(). Remember to use createCanvas() to specify the dimensions of your window and wrap all of your code inside a setup() function

I started this assignment by reflecting about what I’d like to draw. Like so many assignments at ITP, from this early perspective at least, we had a lot of agency to take this in any direction. I recently came back from a trip to the Grand Tetons and Yellowstone National Park, so images of the outdoors are still fresh in my mind. After doing some research into the National Parks’ design system for Visual Language, I decided to make my own outdoor drawing.

public.jpeg

I’m not very experienced in drawing, but regardless, with the assignment in mind I tried to keep the shaped in my sketch to those that I knew were possible with 2D primitives in p5. Part of my goal with the assignment was to familiarize myself with the basic drawing functions, including curves, before we moved on to more advanced concepts.

Along the way, my final image transformed. I started with a blue background and bright green grass— a sunny day, with trees and a river taking center stage. But when I looked at my screen after being away for a while, the brightness was a little jarring, and the river just didn’t look right. I tried varying the background to look more like a sunset— that looked better!

Then I started to move the sun around until it look natural. Behind the mountains or fully visible? Closer to the red part of the sunset or higher up? This was not a very scientific process— I looked at a couple sunset pictures but ultimately just went with my intuition.

After getting rid of the rivers (and my use of the curve function,) the screen looked a little too barren.

“Well, the assignment did mention a self-protrait as inspiration… How about I add a stick figure backpacker?”

This did the trick— now the image has a little more movement and a central character. I added some stars to the night sky emerging as the sun fades away.

The final image captured a little taste of the magic that I remember of the Tetons in the evening.

Image of a stick figure hiker hiking up a hill with mountains in the background, a sun fading, and a multi-color sky with stars starting to emerge.

To see the code for this image, go to this link: https://editor.p5js.org/nkumar23/sketches/JujD9a_vr

OK Computing

As a general rule, when I consume a lot of something, I want to know how to make that thing to some baseline level of competence. Whether it’s food, music, literature or film, this principle has generally held. So much of my recent life has been connected to computing, computers, software, and the software industry-- and although I’ve started learning to code a number of times without really going all-in, I’ve never forced myself to sink or swim on a coding project. It’s time to change that.

I’m excited to make progress in ICM towards knowing how to code beyond a conceptual level. I’m excited to make mistakes and debug even when I want to stop. I’m excited to write functions, learn some of the weirdness of JavaScript-- and hopefully to be confident with my ability to learn more complex concepts and languages after this semester ends.

As someone who’s sat on the “non-technical” side of software companies, often in roles that hybridized design, product and business development, I’ve had to learn how to work with engineers and explain technical concepts without actually building them. After ITP, maybe even after this course, I’ll want to cross the line into the “technical.”

But I could have gone to a bootcamp if that’s all I wanted. Being at ITP means that I’ll have the space to wield code as another medium among many. In this course, I want to use code in conjunction with music, video, data and/or text. I want to keep my mind open to the specific projects I might undertake, but regardless of what I do, I’d like to make use of the freedom to be weird and explore the non-practical while outside the confines of the workplace. 

I love making music. I love teaching. I love cooking. I’m a fan of music videos, animations, and informative, playful uses of data. Maybe some of these will come together with code this semester. But with each day, as we have stimulating conversations and rapidly add new skills and perspectives, I’m just as excited about creating something I wouldn’t have expected from my September 10, 2019 perspective as I am about anything I’m walking in the door with. Let’s go!