Assignment: Expose a signal from some under-represented part of your body.
Idea
Our bodies produce signals that we can’t see, but often can feel in one dimension or another. Whether pain or restlessness, euphoria or hunger, our body has mechanisms for expressing the invisible.
Some of its signals, however, take time to manifest. Small amounts of muscle tension only convert into pain after crossing some threshold — which, in some cases, could take years to reach. I clench my teeth at night, which only became visible a few years ago when the enamel on my teeth showed significant wear and tear. At various times, I had unexplainable headaches or jaw lock; but for the most part, my overnight habits were invisible and not sense-able.
With technological prostheses, however, we can try to shift the speed at which we receive signal. This week, I built a muscle tension sensor to wear on my jaw while sleeping with the hope that I could sense whether I still clench my jaw. Long story short: I most likely do still clench my jaw, but without spending more time on statistical analysis of my results, it’s not wise to read too deeply into the results.
I’ll go over the process and results, but perhaps the most important reflection in this whole process is that even in my 3-day experiment, it was possible to see the possible pitfalls that accompany trying to quantify and infer meaning from data in situations that include even minimal amounts of complexity.
Process
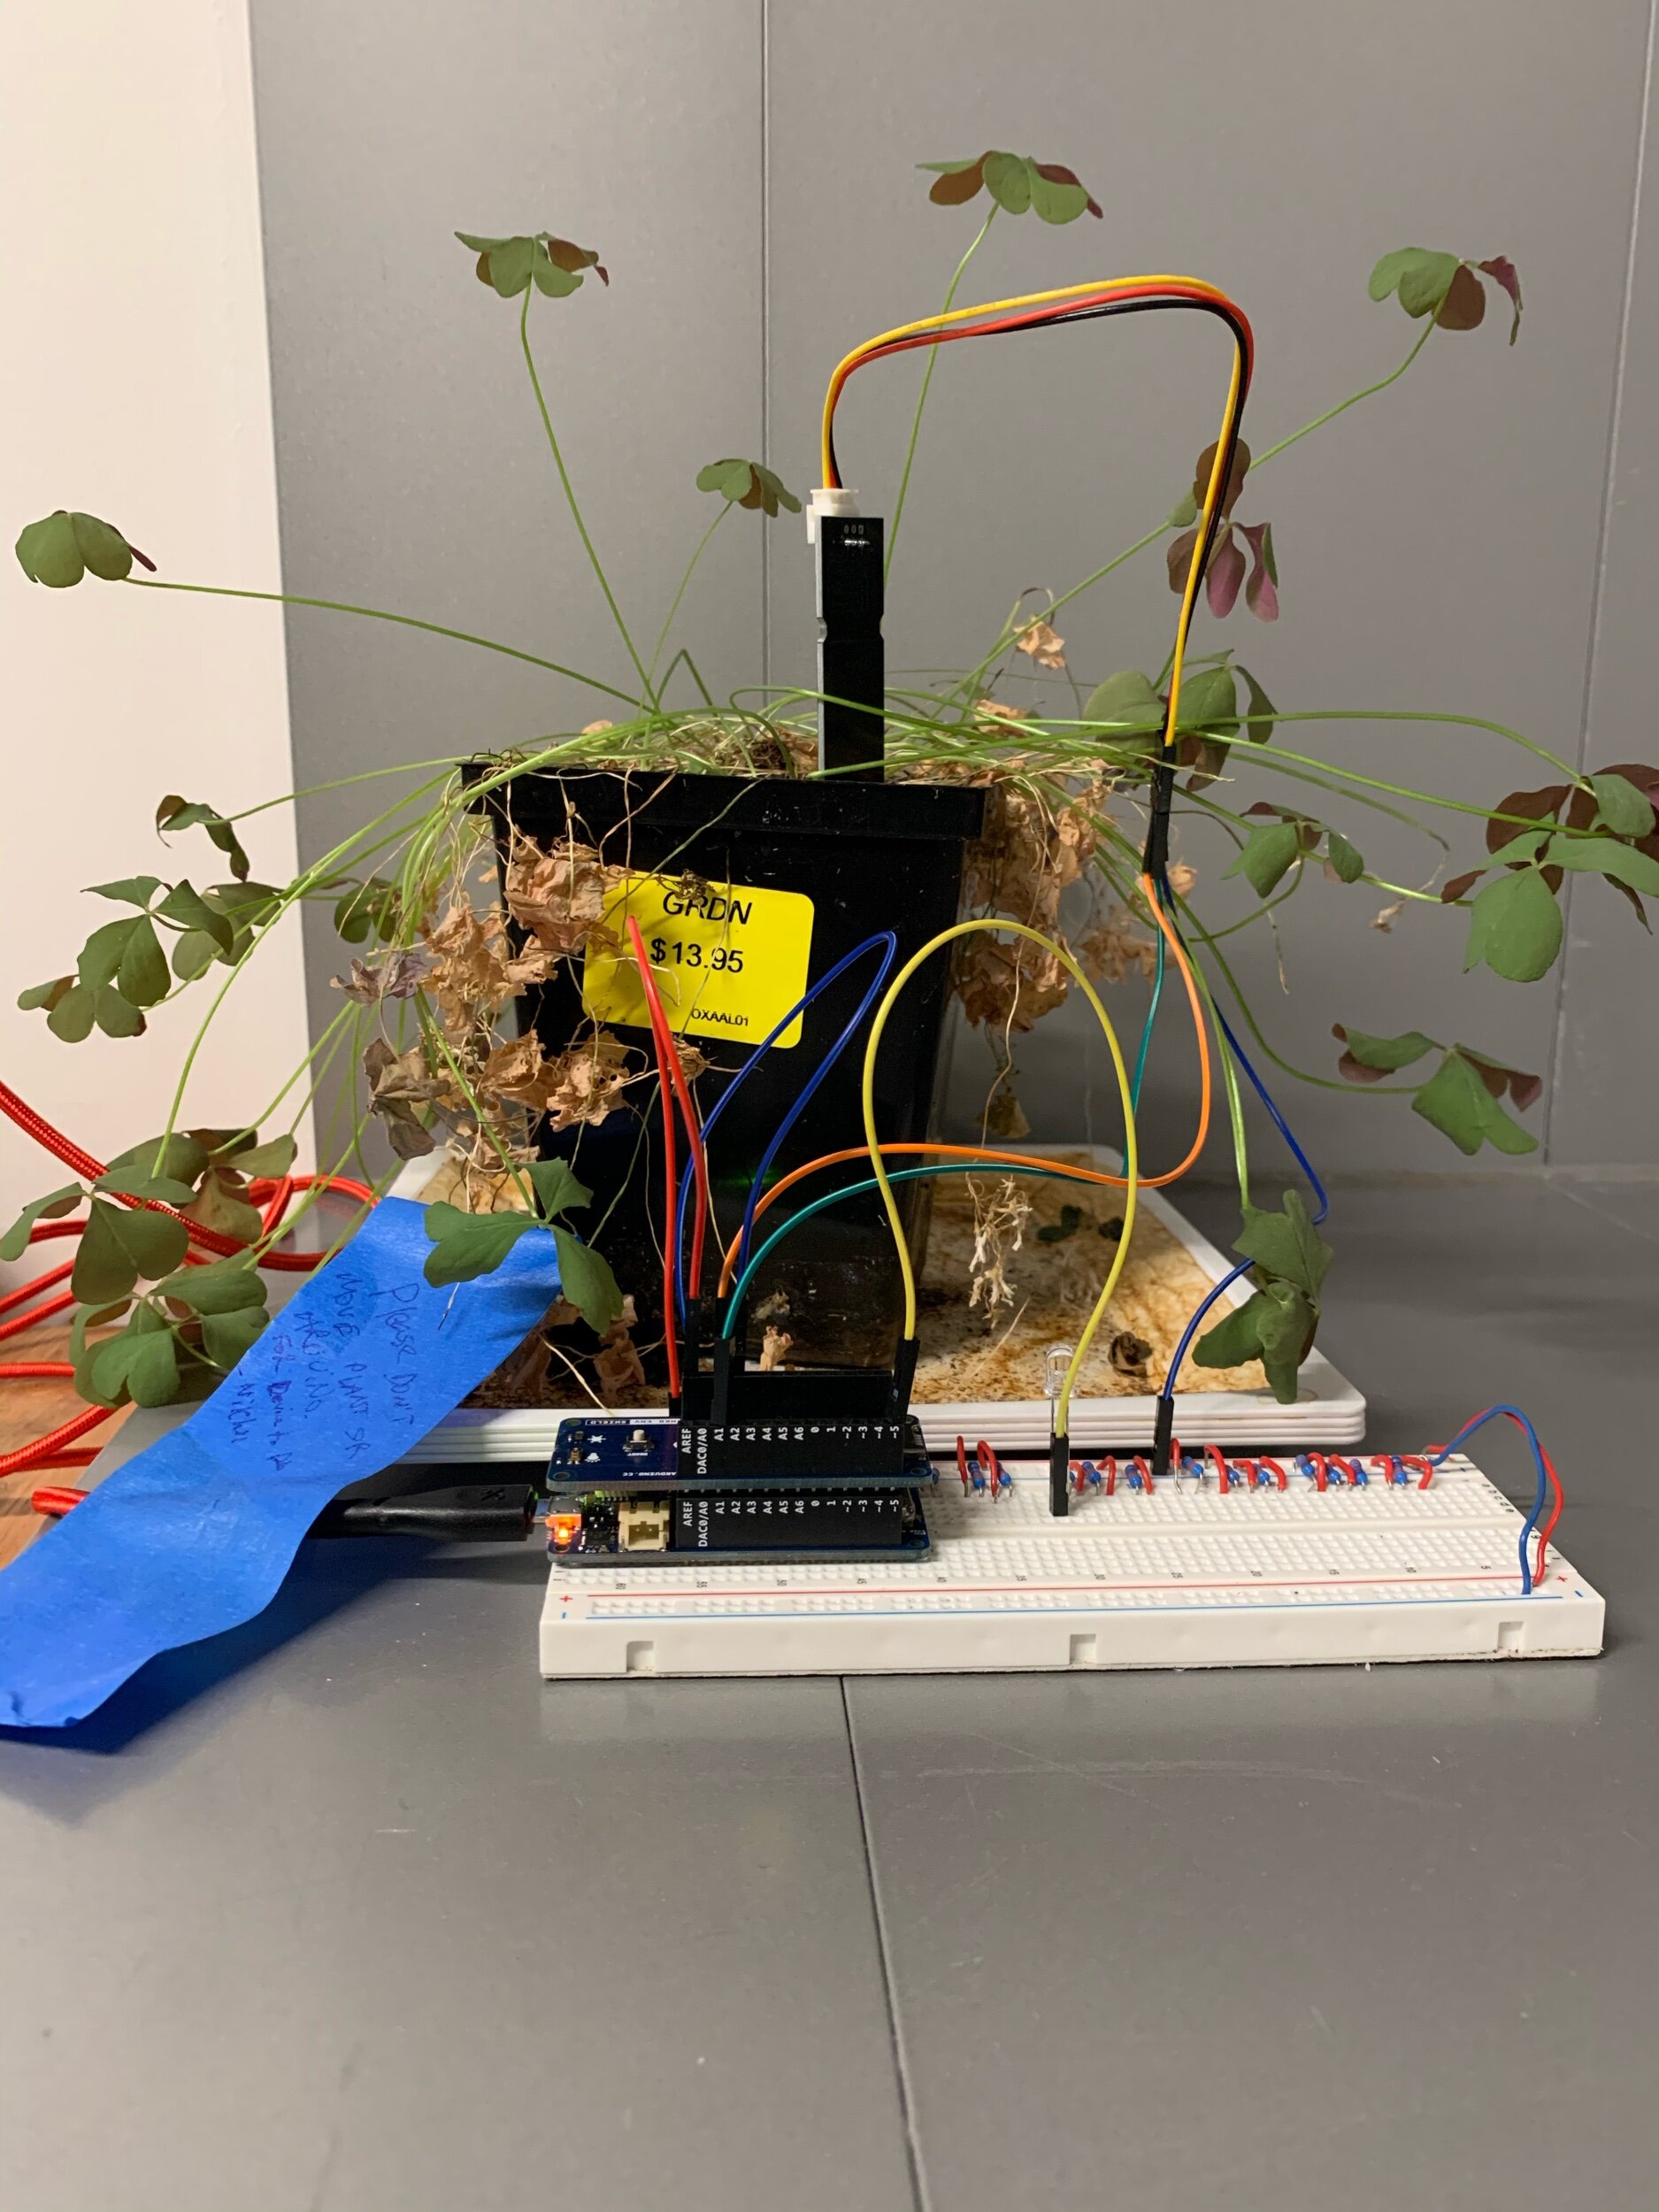
This experiment required the following pieces:
Wire together a muscle tension sensor and microcontroller
I used a MyoWare muscle sensor and Arduino MKR WiFi 1010
Send data from the sensor to a computer
I used the MQTT protocol to wirelessly send data from my Arduino to a Mosquitto server
Write the data from the server to a database
I used a node.js script to listen to the MQTT data and write it to a local SQLite database on my computer
Analyze data from the database
I used Pandas, Matplotlib — common Python libraries— and the SQLIte package to shape and analyze my data
[As a side note: prior to this assignment, I had not used a number of these different technologies, especially not in such an interconnected way. The technical challenge, and the opportunity to learn a number of useful skills while tackling these challenges, was a highlight of the week!]
I started by assembling the hardware and testing on my forearm to make sure it worked properly:

I then moved to testing that it could sense jaw clenching (it did):
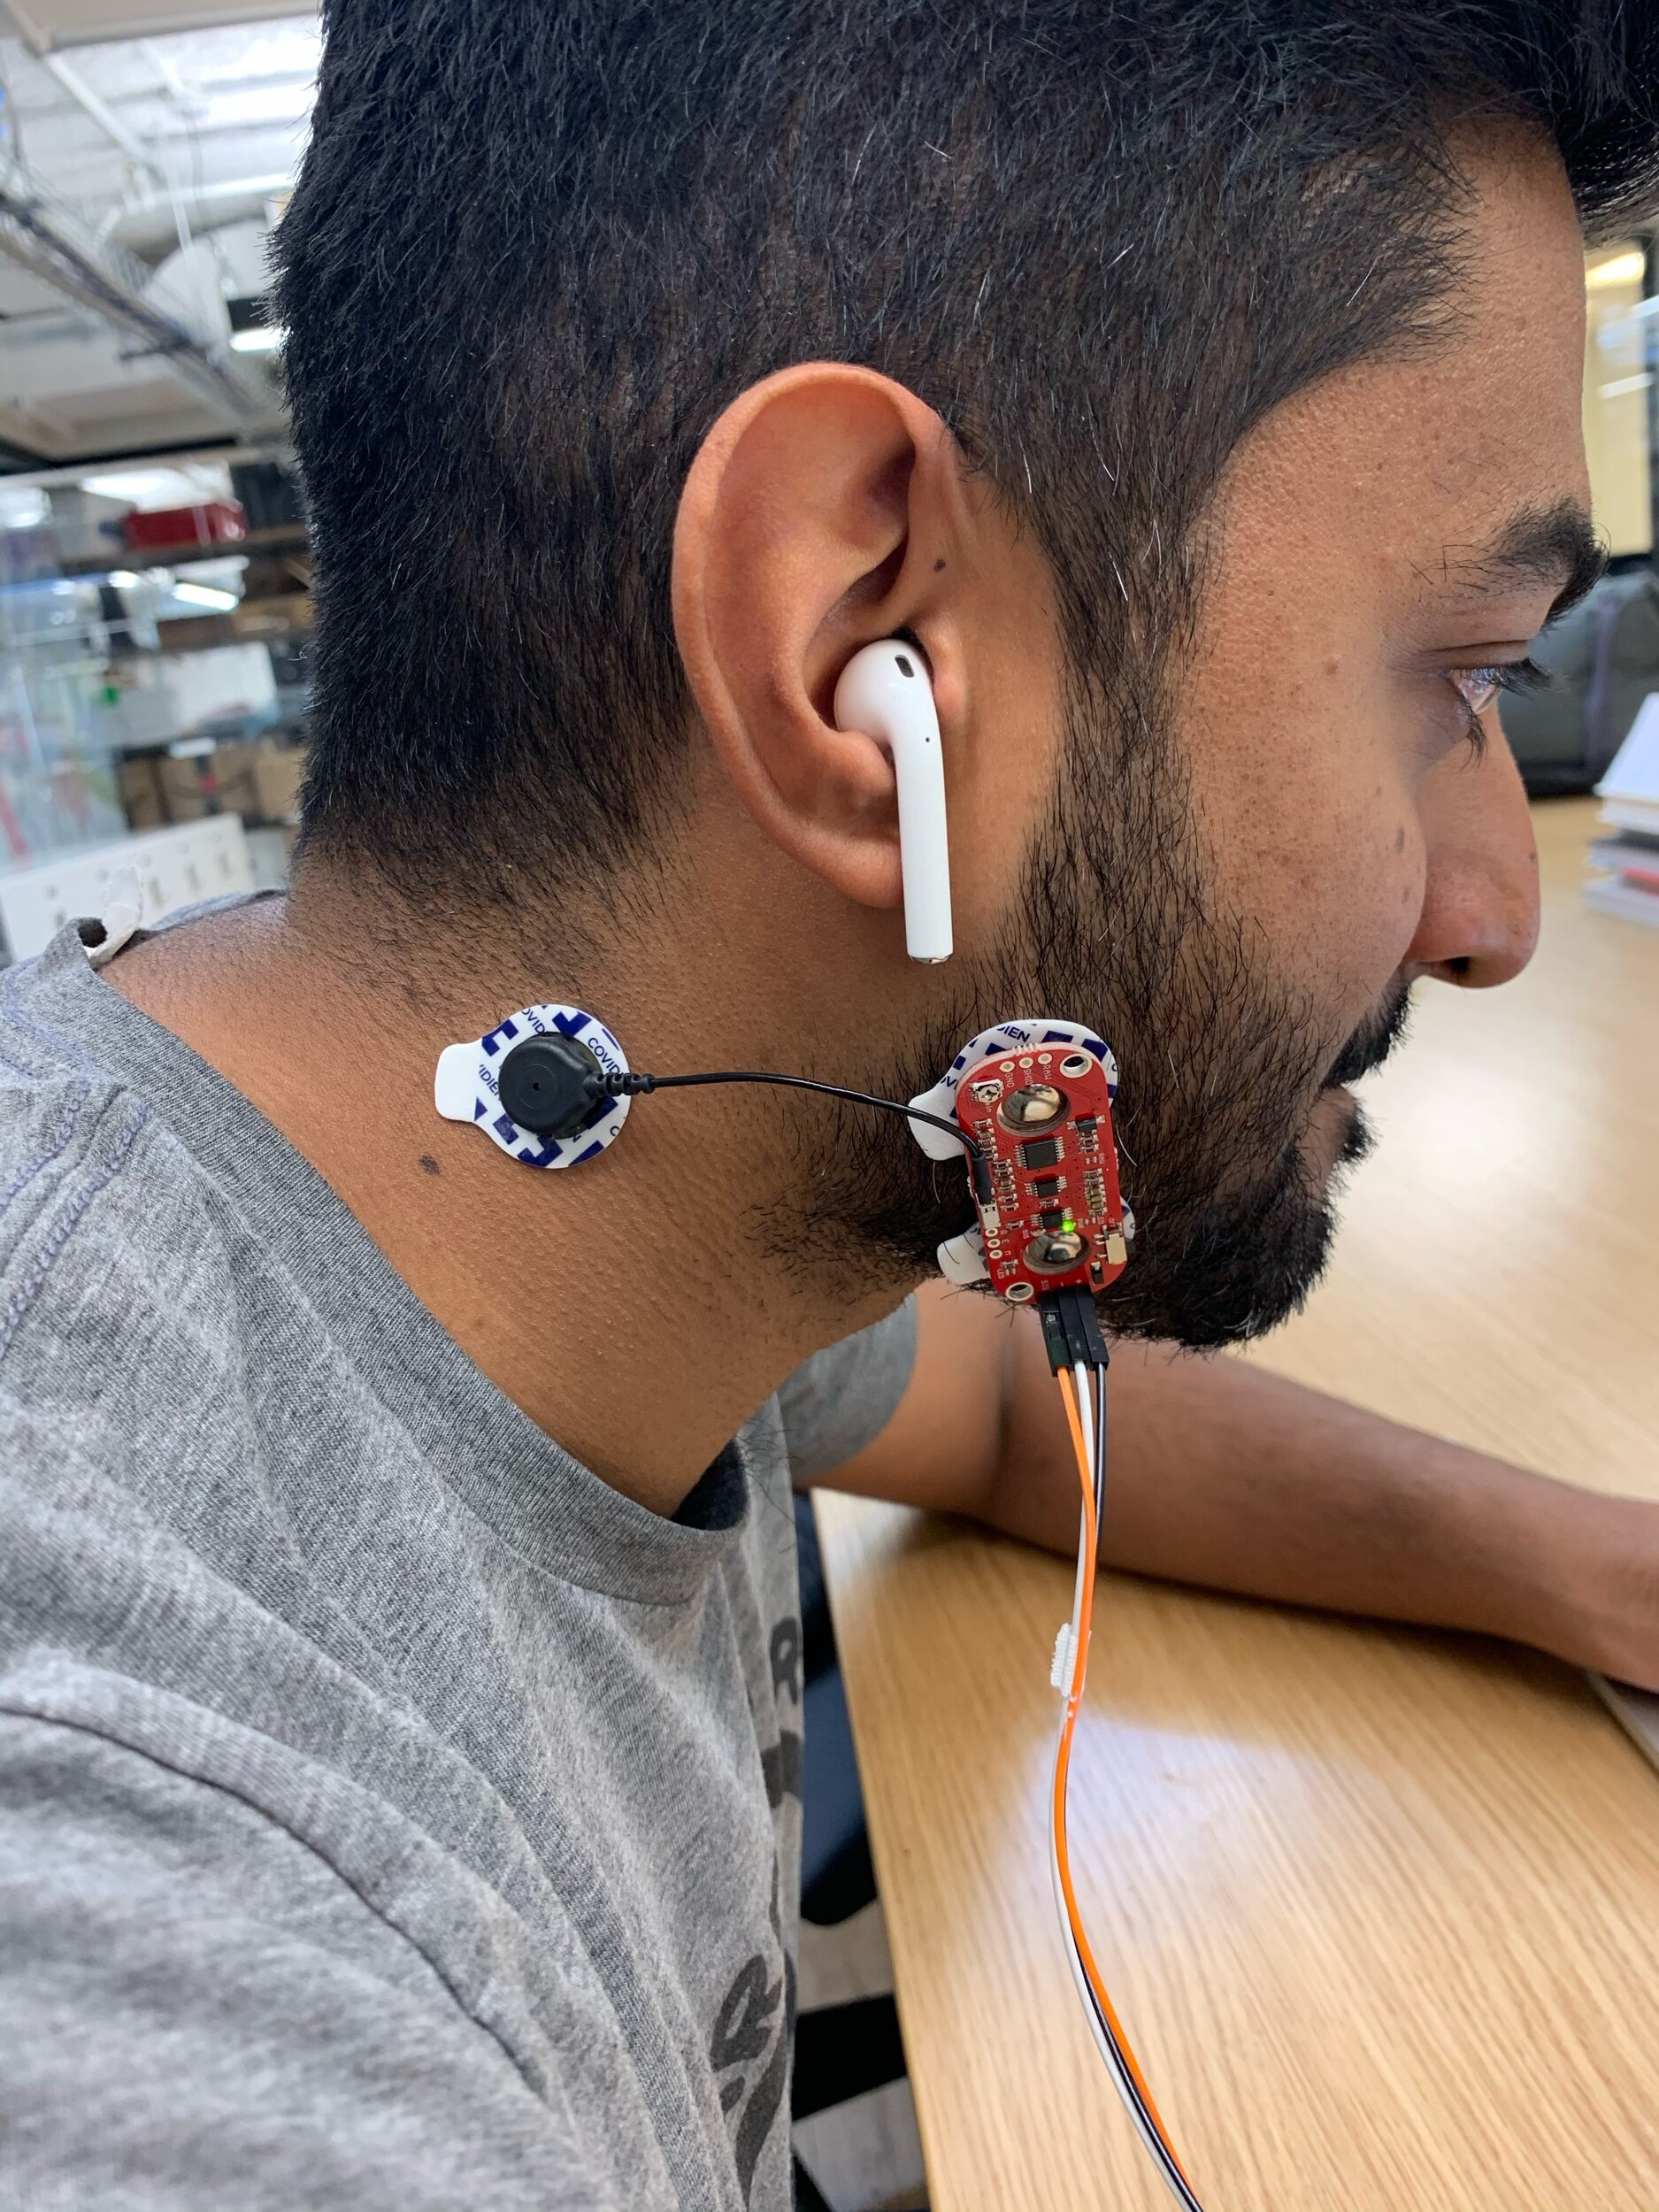
Ultimately, I put it to the test at night. The first night I tried to use the sensor, my beard seemed to interfere with the electrodes too much. In true dedication to science, I shaved off my beard for the first time in years :P It seemed to do the trick:

Results
OK, so— what happened?
First, the basics: This data was collected on Saturday night into Sunday morning for ~8 hours. I wore the sensor on my right jaw muscle and took 2 readings per second the entire time.
And a few caveats: this is only one night’s worth of data, so it is really not conclusive whatsoever. It’s really just a first set of thoughts, which can hopefully be refined with more data and Python know-how. I also did not capture film of my sleeping to crosscheck what seems to be happening in the data with what actually happened in real life.
With that said, here’s one explanation of what happened.
Throughout the night, it’s likely that I shifted positions 5-10 times in a way that affected the sensor. In the graph below, there are clusters of datapoints that appear like blue blocks. Those clusters are periods where the readings were fairly consistent, suggesting that I may have been sleeping in one consistent position. These clusters are usually followed by a surge in reading values, which happen when the sensor detects muscle tension, but also happened when I would touch the sensors with my hand to test calibration. When sleeping, it’s possible that I rolled over onto the sensor, triggering periods where the readings were consistently high.

During those fairly-stable periods, there are still a lot of outlying points. By zooming into one “stable” area, we can look at what’s happening with a bit more resolution:

This is a snapshot of 1 minute. During the beginning of the snapshot, the sensor values are clustered right around a reading of 100. Then there is a gap in readings— the readings were higher than 400 and I didn’t adjust the y-axis scale for this screenshot— then they return to ~100 before spiking to 400. The finally begin returning to an equilibrium towards the end of the minute.

This could be evidence of the jaw-clenching that I was looking for initially. It would be reasonable to expect jaw clenching to last only for a few seconds at a time, but that it could happen many times in a row. Perhaps this data shows this in action — I am sleeping normally, clench my jaw for a few seconds, relax again for 5 seconds, and then clench my jaw for another 5 seconds before letting up.
Ultimately, it looks like this sensor data may unveil 2 behaviors for the price of 1: shifts in sleeping position + jaw clenching!
Reflections
In order to make these insights somewhat reliable, I need to do a few things:
Collect more data
This is only one night’s worth of data. It’s possible that this is all noise, the sensor didn’t actually work at all, and I’m just projecting meaning onto meaningless data. A bigger sample size could help us see what patterns persist day after day.
Collect data from different people
In order to validate the hypothesis that high-level clusters explain shifts in position and more granular clusters/outliers show jaw clenching, I’d need to try this with other people. I know that I clench my jaw, but if someone who doesn’t clench still has similar patterns in data, I’d need to revisit these hypothesis.
Validate insights against reality
If I had video of my night, or if some house elf took notes while I slept, we could tag different actual behaviors and timestamps. Capturing shift in position should be relatively easy to do, as long as I get the lighting figured out. Clenching might be harder to capture on video.
Statistical analysis
I used the scatterplot to see obvious visual patterns. Using some clustering analysis, I could understand the relationships between clusters and outliers at a more detailed level.
Beyond what I could do to improve this analysis, I think there’s a bigger point to make: we should be skeptical of the quantified data we are presented with and ask hard questions about the ways in which the presenters of data arrived at their conclusions. In my experiment above, I could have made some bold claim about my sensor being able to detect sleep positions and TMJ-inducing behavior, but the reality is that the data needs a lot of validation before any insights can be made confidently. While academia has checks and balances (which themselves have a lot of issues), the rise of popular data science and statistics has not been coupled with robust fact-checking. So — before going along with quantified-self data, make sure to ask a lot of questions about what might be causing the results!
Thanks to Don Coleman and his course Device to Database — extremely helpful for this technical implementation of this project.