Listening to Bio-Signal (Or: JAWZZZ)

Assignment: Expose a signal from some under-represented part of your body.

Idea

Our bodies produce signals that we can’t see, but often can feel in one dimension or another. Whether pain or restlessness, euphoria or hunger, our body has mechanisms for expressing the invisible.

Some of its signals, however, take time to manifest. Small amounts of muscle tension only convert into pain after crossing some threshold — which, in some cases, could take years to reach. I clench my teeth at night, which only became visible a few years ago when the enamel on my teeth showed significant wear and tear. At various times, I had unexplainable headaches or jaw lock; but for the most part, my overnight habits were invisible and not sense-able.

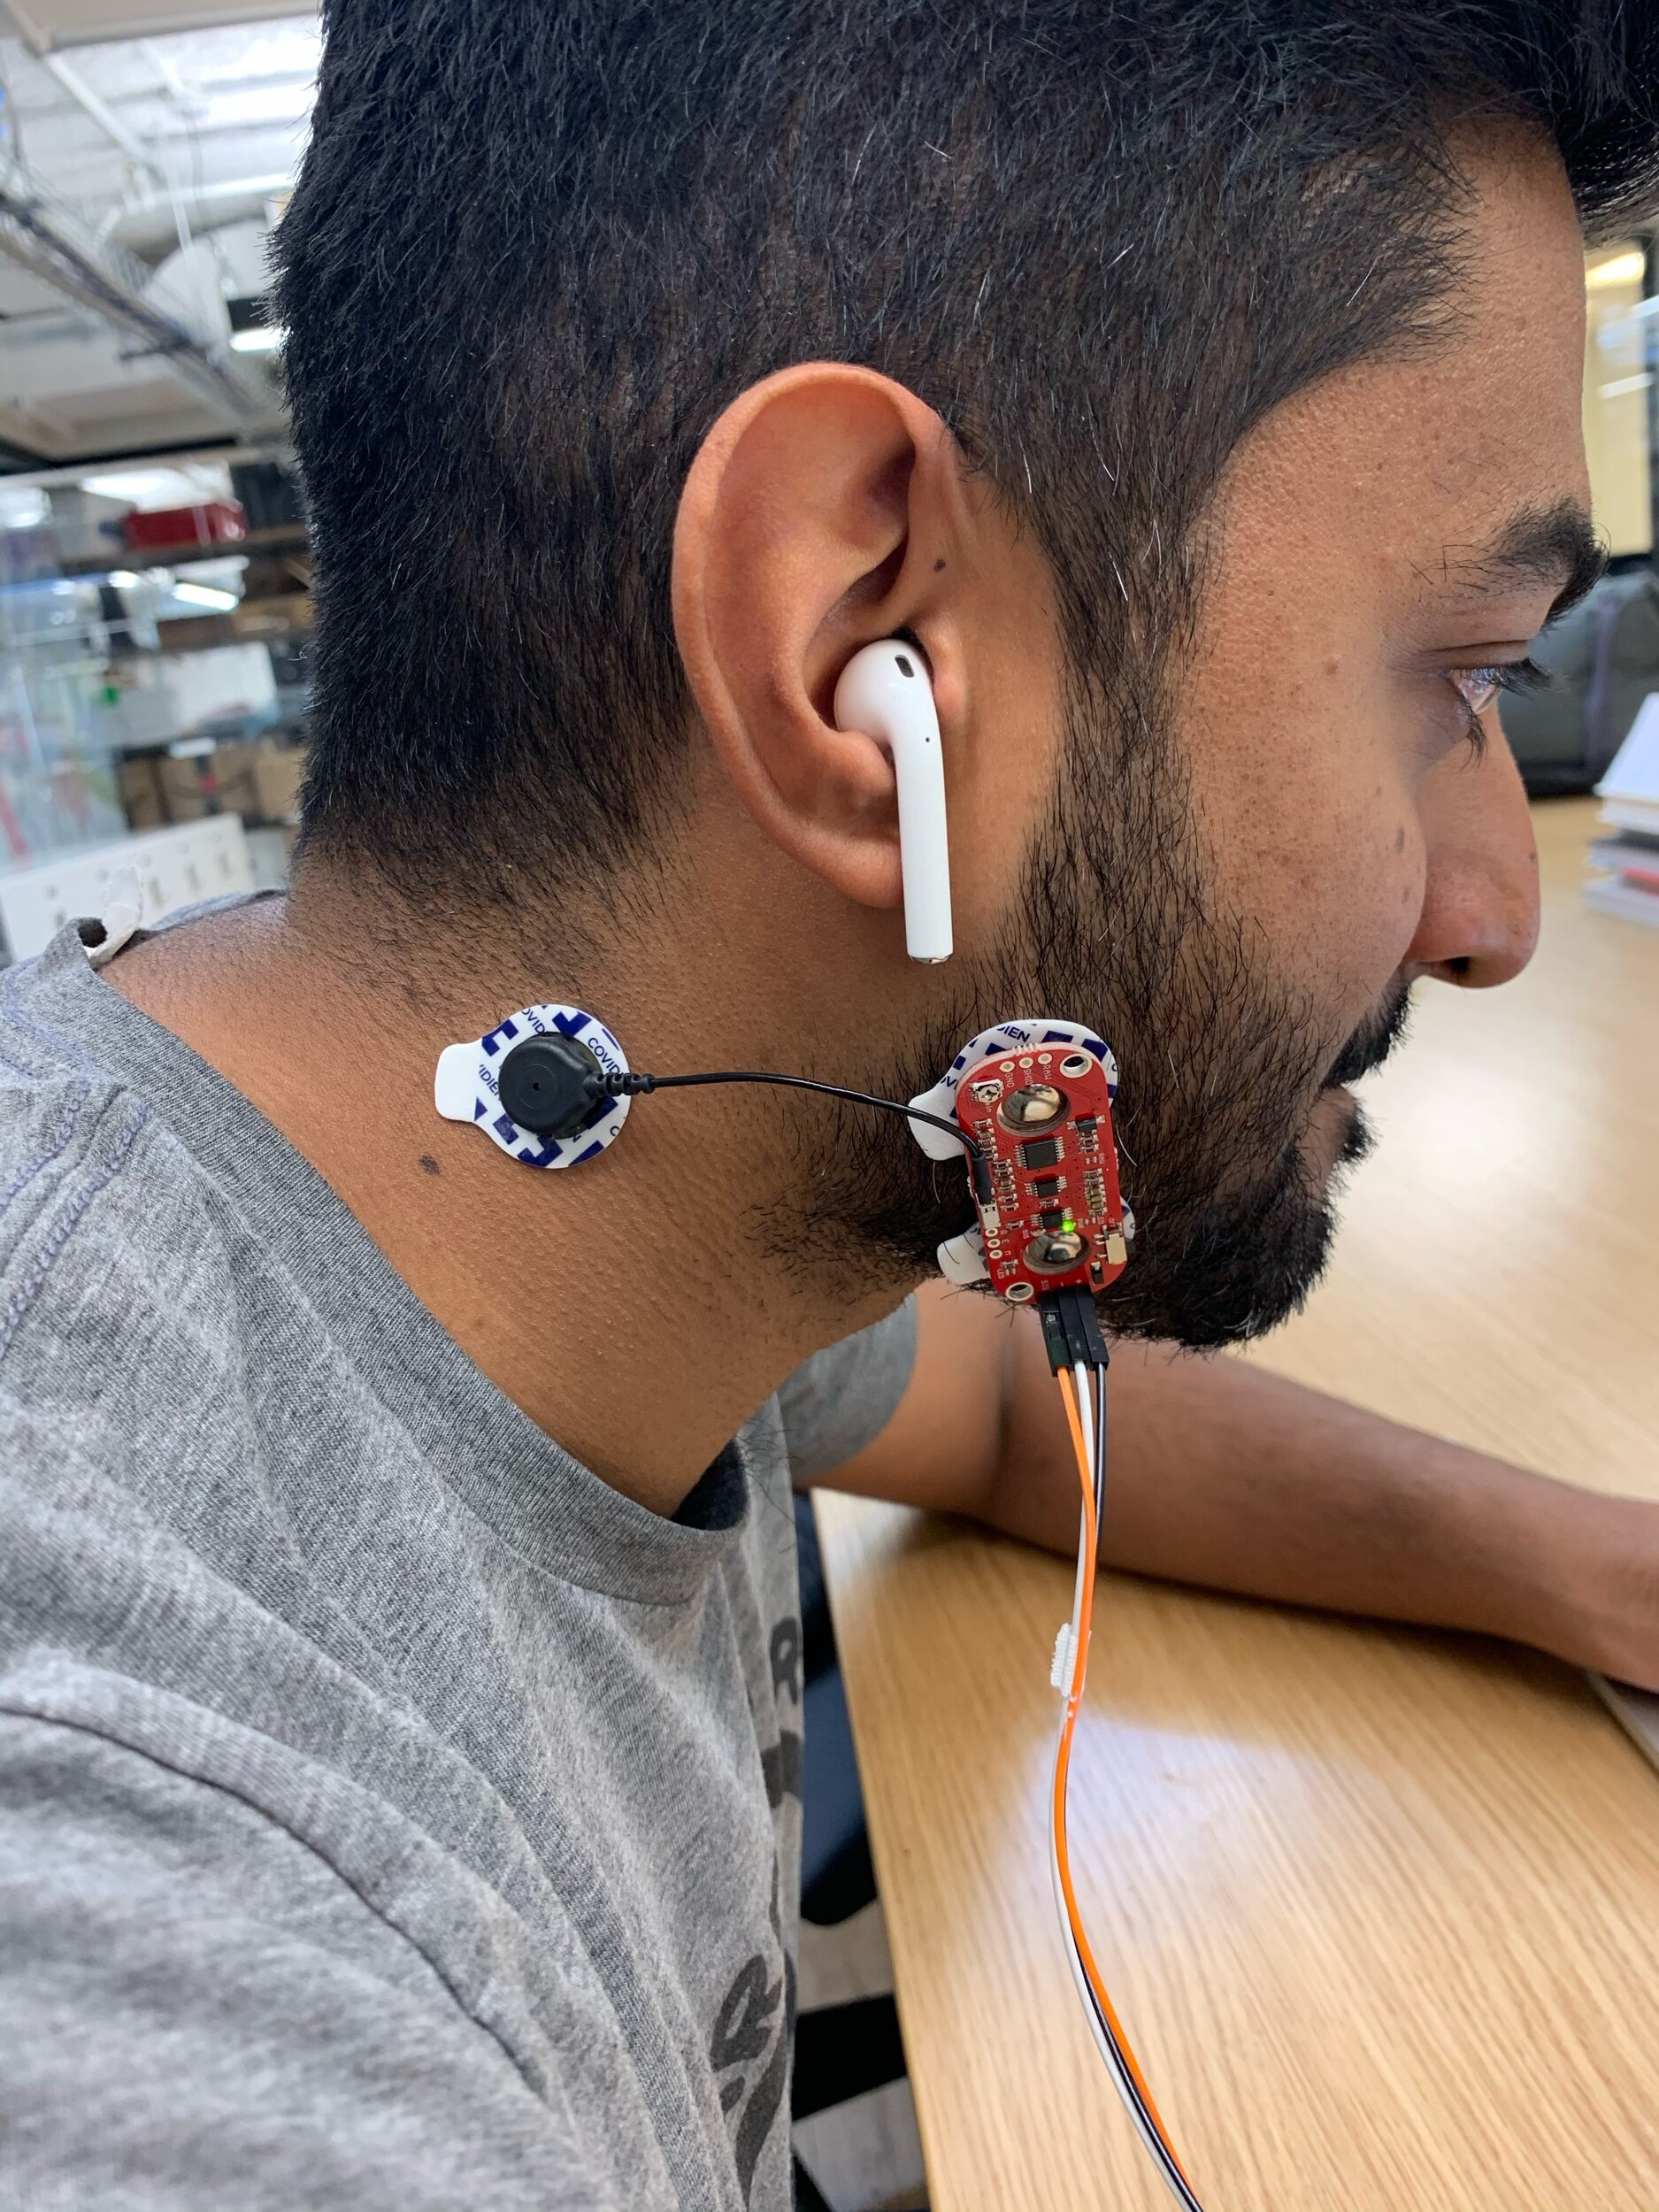
With technological prostheses, however, we can try to shift the speed at which we receive signal. This week, I built a muscle tension sensor to wear on my jaw while sleeping with the hope that I could sense whether I still clench my jaw. Long story short: I most likely do still clench my jaw, but without spending more time on statistical analysis of my results, it’s not wise to read too deeply into the results.

I’ll go over the process and results, but perhaps the most important reflection in this whole process is that even in my 3-day experiment, it was possible to see the possible pitfalls that accompany trying to quantify and infer meaning from data in situations that include even minimal amounts of complexity.

Process

This experiment required the following pieces:

  • Wire together a muscle tension sensor and microcontroller

  • Send data from the sensor to a computer

    • I used the MQTT protocol to wirelessly send data from my Arduino to a Mosquitto server

  • Write the data from the server to a database

    • I used a node.js script to listen to the MQTT data and write it to a local SQLite database on my computer

  • Analyze data from the database

[As a side note: prior to this assignment, I had not used a number of these different technologies, especially not in such an interconnected way. The technical challenge, and the opportunity to learn a number of useful skills while tackling these challenges, was a highlight of the week!]

I started by assembling the hardware and testing on my forearm to make sure it worked properly:

IMG_4615.jpeg

I then moved to testing that it could sense jaw clenching (it did):

IMG_4632.jpeg

Ultimately, I put it to the test at night. The first night I tried to use the sensor, my beard seemed to interfere with the electrodes too much. In true dedication to science, I shaved off my beard for the first time in years :P It seemed to do the trick:

Adjustments.jpeg

Results

OK, so— what happened?

First, the basics: This data was collected on Saturday night into Sunday morning for ~8 hours. I wore the sensor on my right jaw muscle and took 2 readings per second the entire time.

And a few caveats: this is only one night’s worth of data, so it is really not conclusive whatsoever. It’s really just a first set of thoughts, which can hopefully be refined with more data and Python know-how. I also did not capture film of my sleeping to crosscheck what seems to be happening in the data with what actually happened in real life.

With that said, here’s one explanation of what happened.

Throughout the night, it’s likely that I shifted positions 5-10 times in a way that affected the sensor. In the graph below, there are clusters of datapoints that appear like blue blocks. Those clusters are periods where the readings were fairly consistent, suggesting that I may have been sleeping in one consistent position. These clusters are usually followed by a surge in reading values, which happen when the sensor detects muscle tension, but also happened when I would touch the sensors with my hand to test calibration. When sleeping, it’s possible that I rolled over onto the sensor, triggering periods where the readings were consistently high.

annotated jaw analysis.png

During those fairly-stable periods, there are still a lot of outlying points. By zooming into one “stable” area, we can look at what’s happening with a bit more resolution:

Screen Shot 2020-02-23 at 6.36.50 PM.png

This is a snapshot of 1 minute. During the beginning of the snapshot, the sensor values are clustered right around a reading of 100. Then there is a gap in readings— the readings were higher than 400 and I didn’t adjust the y-axis scale for this screenshot— then they return to ~100 before spiking to 400. The finally begin returning to an equilibrium towards the end of the minute.

jaw analysis 2.png

This could be evidence of the jaw-clenching that I was looking for initially. It would be reasonable to expect jaw clenching to last only for a few seconds at a time, but that it could happen many times in a row. Perhaps this data shows this in action — I am sleeping normally, clench my jaw for a few seconds, relax again for 5 seconds, and then clench my jaw for another 5 seconds before letting up.

Ultimately, it looks like this sensor data may unveil 2 behaviors for the price of 1: shifts in sleeping position + jaw clenching!

Reflections

In order to make these insights somewhat reliable, I need to do a few things:

  • Collect more data

    • This is only one night’s worth of data. It’s possible that this is all noise, the sensor didn’t actually work at all, and I’m just projecting meaning onto meaningless data. A bigger sample size could help us see what patterns persist day after day.

  • Collect data from different people

    • In order to validate the hypothesis that high-level clusters explain shifts in position and more granular clusters/outliers show jaw clenching, I’d need to try this with other people. I know that I clench my jaw, but if someone who doesn’t clench still has similar patterns in data, I’d need to revisit these hypothesis.

  • Validate insights against reality

    • If I had video of my night, or if some house elf took notes while I slept, we could tag different actual behaviors and timestamps. Capturing shift in position should be relatively easy to do, as long as I get the lighting figured out. Clenching might be harder to capture on video.

  • Statistical analysis

    • I used the scatterplot to see obvious visual patterns. Using some clustering analysis, I could understand the relationships between clusters and outliers at a more detailed level.

Beyond what I could do to improve this analysis, I think there’s a bigger point to make: we should be skeptical of the quantified data we are presented with and ask hard questions about the ways in which the presenters of data arrived at their conclusions. In my experiment above, I could have made some bold claim about my sensor being able to detect sleep positions and TMJ-inducing behavior, but the reality is that the data needs a lot of validation before any insights can be made confidently. While academia has checks and balances (which themselves have a lot of issues), the rise of popular data science and statistics has not been coupled with robust fact-checking. So — before going along with quantified-self data, make sure to ask a lot of questions about what might be causing the results!

Thanks to Don Coleman and his course Device to Database — extremely helpful for this technical implementation of this project.

The A-Minor Music Machine

So that this doesn’t get buried under the reflections below, here’s the sketch. I will update here when the version that works with Arduino is functional.

——

Within 10 minutes of posting this, I’ll probably be editing code again. This project, more than any up to this point, drove me insane and made me so happy.

At various points in the week, I grunted out loud to myself (and anyone in my general vicinity) as I failed to notice a missing “this.”; I enlisted a former software developer colleague to hop on the phone and talk me through questions late at night when office hours were no longer an option; I thought I’d reached a nice stopping place, then thought of one more feature, then looked up and another hour went by.

And in the process, my empathy for all the devs I know just increased exponentially from an already- empathetic place.

With the preamble aside— what was the assignment? What did I make?

The assignment this week was to use objects, classes, arrays of objects, and interactions between objects. I hadn’t yet used sound in a p5 sketch, so I made that a constraint for myself— do all of the above while using sound.

I got inspiration for this sketch from this example; after looking at it I wanted to see if I could replicate the effect on 4 different drum sounds on one canvas. I started by trying to get it working without any objects/classes, which you can see here. It worked! From there, I started to see a “sound” object coming together— something that had a type for each type of drum sound (kick, snare, etc). It would also be able to display itself and maybe analyze its amplitude. Simple, right?

The process of migrating this code to an object-oriented structure took a lot longer than I’d expected, and was the source of a lot of the grunting and requests for help. Ultimately, there were a couple of important lessons:

  • Understand variable scoping:

    • Global variables can be used.. um… globally.

      • When using something like p5.Amplitude this was a really important concept to internalize. p5.Amplitude measures the entire output audio unless otherwise specified. If p5.Amplitude is set globally, it’s not possible to setInput later on and have that used to, say, draw rectangle height like I do.

    • this.object is available for all object instances in the class

    • instantiating a variable inside a function within a class scopes that variable to just be available in the function

      • know when to use this vs a this.object

  • While debugging, isolate each action you are trying to perform independent of other actions.

    • Do this by finding or creating variables to console log in order to see whether the program in functioning as expected

  • Keep simplifying

    • I found myself, and still find myself, repeating some code with only small variations for particular cases. Instead of having a bunch of if statements to describe when to play a sound and the same set of if statements describe when to analyze a sound, maybe there could be a common variable that could pass to both .play and .analyze (in this case, this.sound.)

Pieces

I recorded the drum sounds, chords and bass notes in Logic Pro X and exported each sound as an mp3. I loaded those into p5 and used preLoad to make them available to the rest of the sketch.

I used the p5.Amplitude, setInput, and getLevel functions to get the amplitude of any given sound file. I could then pass that amplitude reading (done in the draw function to get it continuously as the file is played) to the rectangle height parameter to create the drum visualizations. Those are triggered by keystrokes.

The chords are stored in an array. The right and left arrows cycle either up or down the array, resetting if they reach the end of the array. When they are created, they get passed a random number between 1 and 6. That number is used to change the background. A few of the numbers change the background color. Others don’t. The number assigned to an instance of an object is random, so there’s no rhyme or reason to when the background changes other than that it only happens when chords are played.

There are some white dots that appear occasionally. These are an array of “Item” objects that get triggered from within the display function. These appear when a particular random number in the chord object appears when a kick drum has been played. In order to make this happen, I created a state variable to measure whether the kick drum has been played (but resets after it gets played). When the kick (and clap, same logic) has played and the random number coincided, these ellipses appear until the condition is no longer true.

The bass notes trigger the triangular visualization in a similar way.

All in all this has been a really rewarding project to really ramp up my understanding of a number of things. As an added bonus, it is a great foundation for working with serial communication in PComp: the variables controlled by keystrokes will be controlled by buttons and other things out in the real world!

PComp experiment to-be

I want to make a Midi controller with my Yeezy shoebox. I built the enclosure last week and just acquired the parts I need to try to get this to work. In conjunction with this week’s material covering serial communication, this seems like a good way to test my understanding.

The logic seems fairly straightforward:

I will connect the potentiometers to analog outputs and connect the buttons to digital outputs, which should send to a midi receiver that I’ll connect to the breadboard and midi port on the Arduino. I’ll write a program that both brings in the Midi library to the Arduino IDE and that sends midi out. I’ll need to convert the analog output to midi’s 0-127 range.

In the midi code, I think I’ll need to map the potentiometers and buttons to midi ports, which my digital audio workstation (Logic) will understand. I’m not sure this is necessary— it might be possible to do this mapping as long as Logic sees that midi is being sent.

I’ll be interested to see where there is more complexity than I anticipated. I’m sure there will be. I’ve found some tutorials online that should help, although I don’t know that any are exactly what I need!

EDIT: I just found this lab on the PComp website! I will follow along with it to see if it gets the job done with my Nano, even though I got an Uno and Midi socket based on the other tutorials I had seen.

PComp Interaction Fail IRL

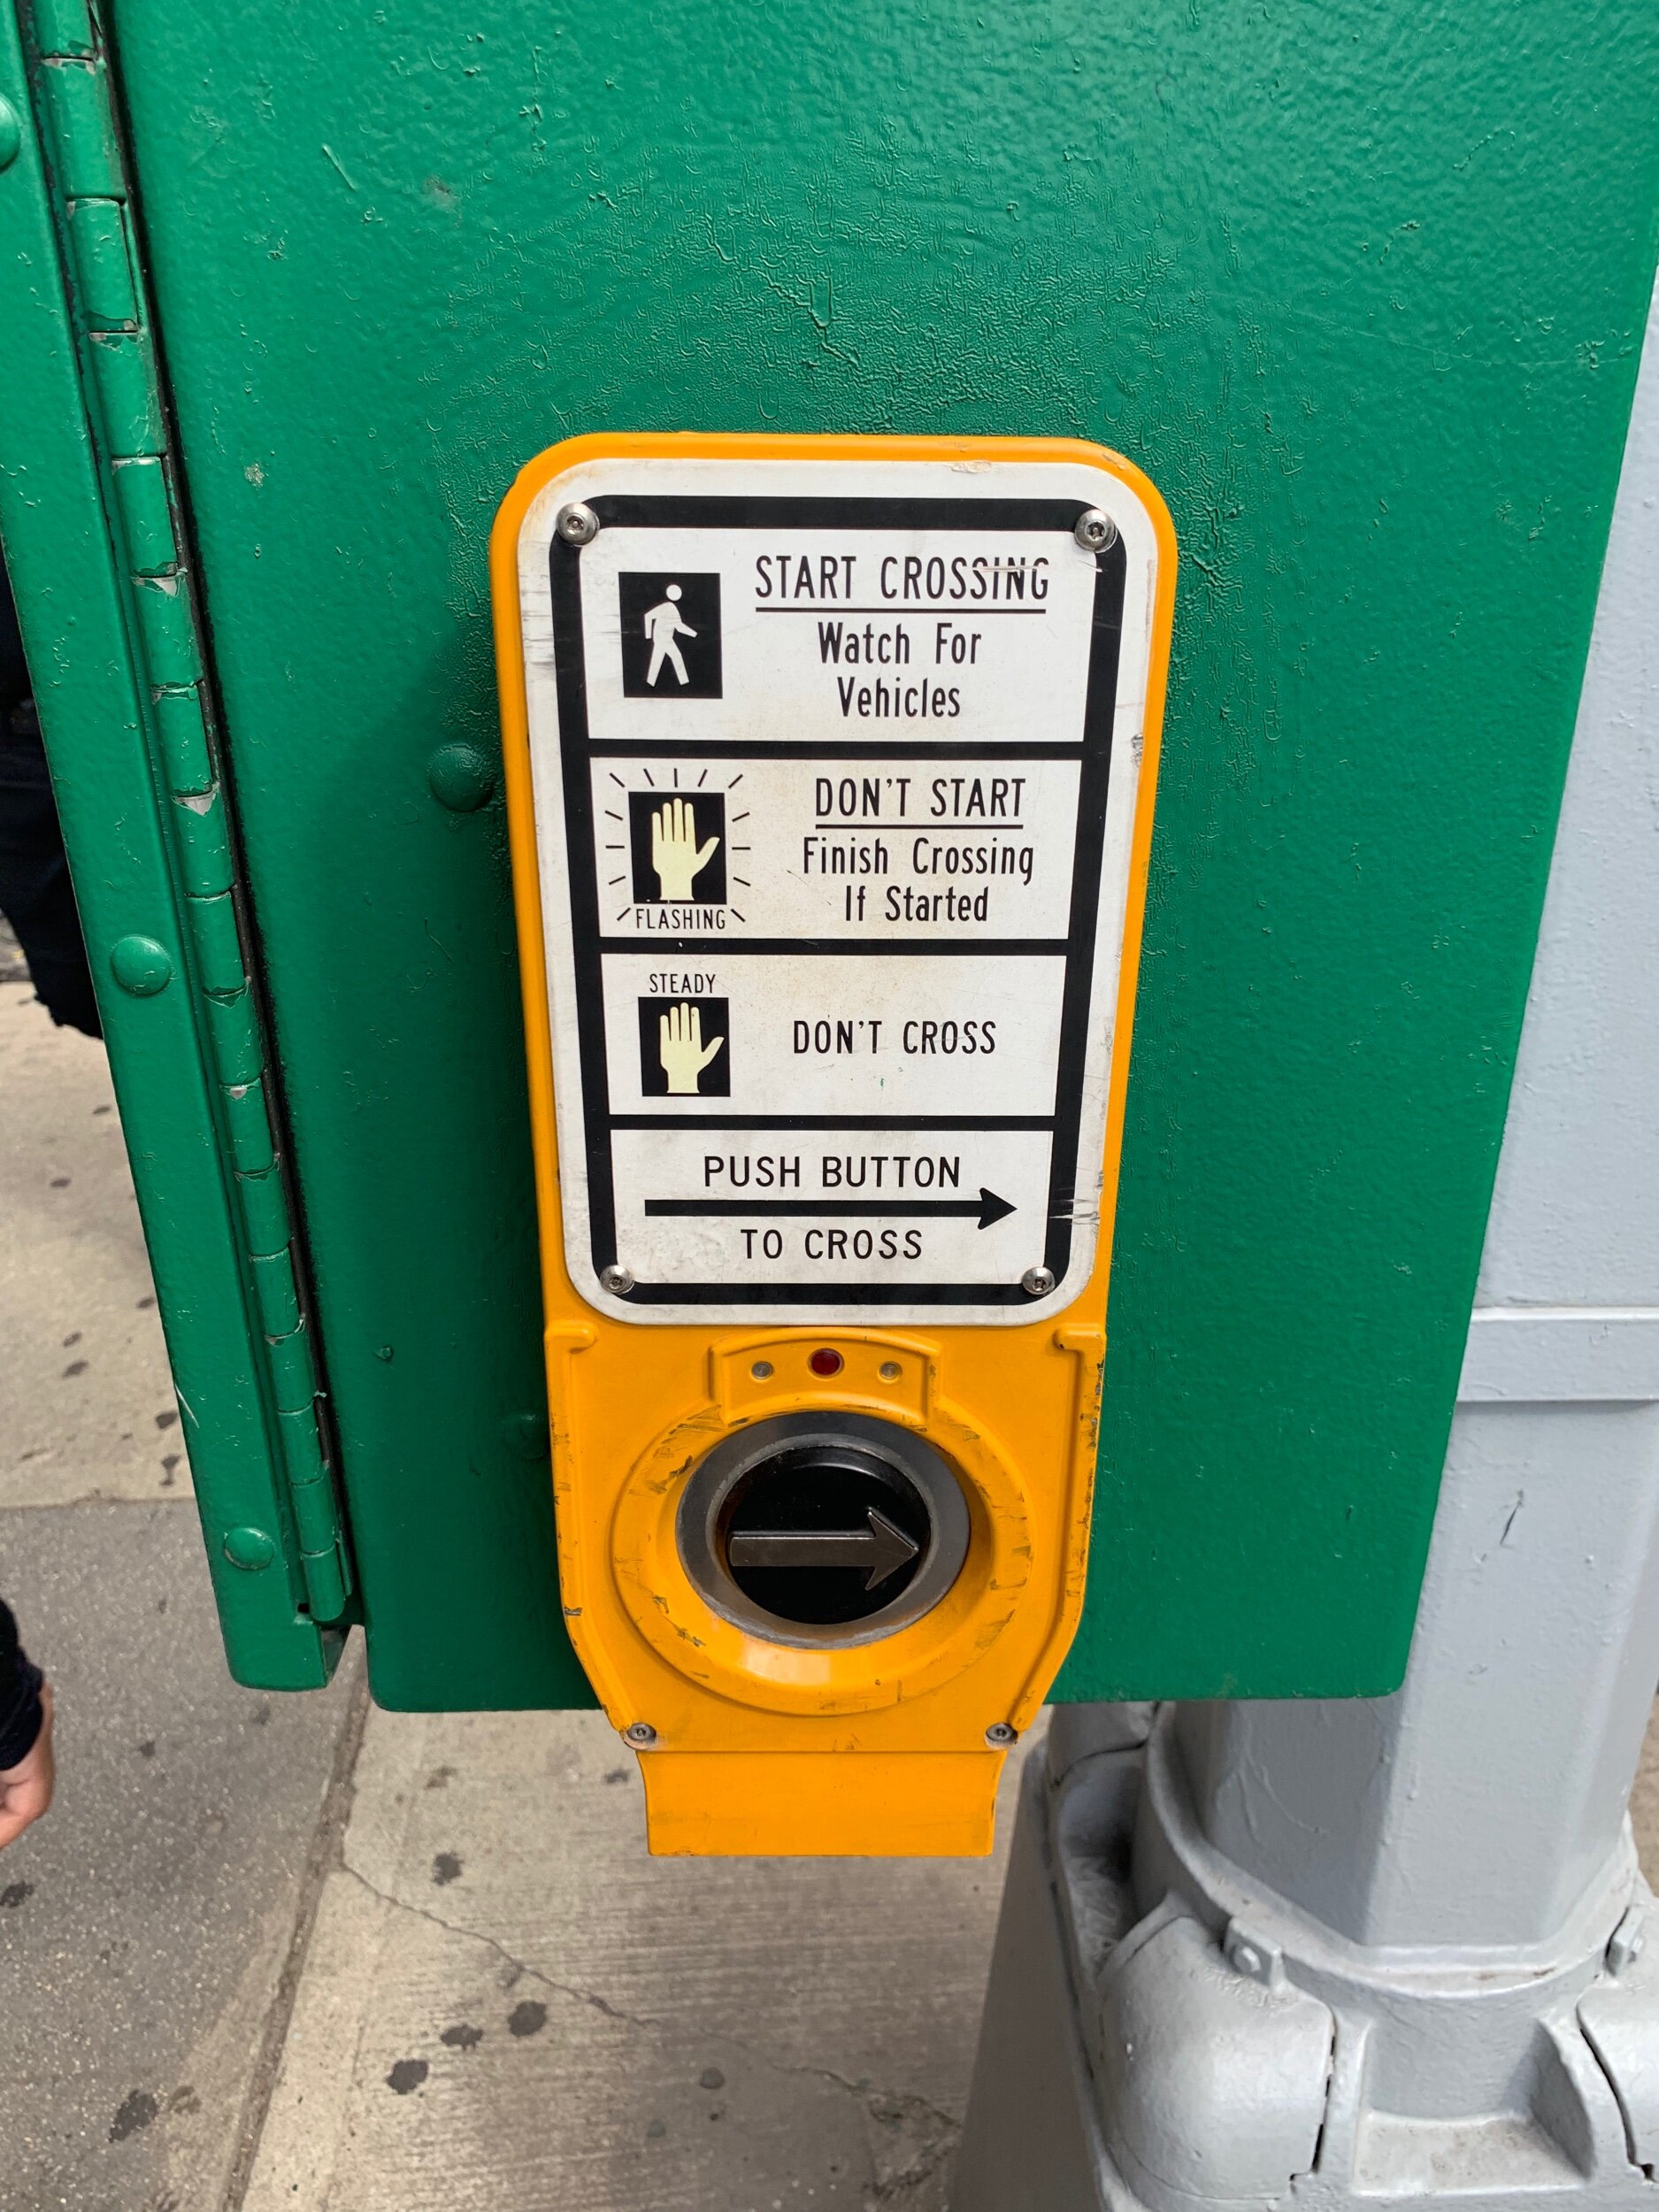
If you live in a city with crosswalks, you’ve probably seen something like this.

public.jpeg

And if you’ve seen this button, you’ve probably wondered whether it actually does anything. The signage suggests that if a pedestrian presses the button, the walk sign will appear and traffic will stop. Of course, traffic doesn’t (and probably shouldn’t) revolve solely around the pedestrian, so the traffic cycle will play out before changing to walk. Often, even if the button is never pressed, the cycle will rotate through walk and don’t-walk signs with no human input. In most of these cases, it’s really difficult to know whether pushing the button has any effect on shortening the cycle. As a result, if you wait on the corner and watch people interact with this button, they will often either not push it at all despite needing to walk, or they’ll repeatedly push it, getting more and more annoyed that nothing is happening.

It’s possible that some of these systems are just placebos that make people feel in-control of the traffic cycle. It’s more likely that the system actually does work in some capacity, but doesn’t communicate what is happening in a satisfying manner. In it’s current state, this feels like a failed interaction, even if the system works as intended.

What could be improved? I’ll offer one suggestion for now. Let’s start by thinking about the different parts of this system:

1) Assume this is a simple intersection with 2 directions of car traffic, left turn lane protections for cars, and 2 directions of pedestrian traffic. There will be walk signs in both directions of traffic, along with stoplights for cars.

2) There is some traffic cadence e.g. 45 seconds for one direction of traffic, then 45 seconds for the other, with a 5 second pause in between.

3) This could be broken into two ranges: the minimum amount of time for traffic to flow before changing could be 30 seconds, and the maximum could be 1 minute.

In this setup, the default could be set to the maximum cadence time— traffic flows for a minute before switching directions. Pushing the button could set the cadence to its minimum of 30 seconds.

Right now, the frustration is generally due to the lack of feedback to the button-pusher. What if there was a simple countdown clock under the button that turns on after the button is pushed? Once the button is pushed, however much time is left on the traffic cadence cycle would be displayed on the countdown clock.

Perhaps this exists already— I have hazy memories of seeing better versions of these walk buttons outside of the US— but if not, I hope to see something like this soon! Even as cities switch to using motion detection for stoplights— having some simple feedback for pedestrians (and perhaps drivers) to understand what is happening under the hood generally will make for a more empathetic, less-frustrating experience.

Hit The Switch

This week’s PComp assignment— somehow our very first— was to make a switch. That’s it— make a switch. Last week in fabrication, I learned the simple mechanical function of a switch in a circuit when I made my pickle flashlight with a traditional on/off pushbutton switch. This week, we were encouraged to get a little more creative. Behold, the latest addition to our collection of things we can procrastinate with later in the semester:

Inspiration

With so many of our interactions limited to touching and swiping, are we losing out on a wider range of potential human expression through interaction? Our discussions in class have been fascinating, and I loved that it naturally led into this assignment. I wanted to use some human action that felt different than touch, and as I was watching some basketball highlights, I thought I’d prototype a throwing-based switch.

Prototype and Process

In my kitchen, I repurposed the circuit from my pickle flashlight, grabbed a solo cup and a piece of crumpled foil out of the recycling bin and gave it a shot… (no pun intended, seriously):

The switch worked! Now for the easy stuff… right? Let’s list out what was left to do:

  • Extend/lengthen the wire setup for a fully conceived design.

  • Make the surface area for the wire contact points as wide as possible to ensure the ball would turn on the light.

  • Solder the wires to the light sources and to the additional contact material to keep them secured, in-contact and not moving around.

  • Secure the cup too— the cup fell over when the foil ball hit the rim.

  • Make everything look better!

With these high-level areas of focus in-hand, I went to work on each part. I started by deciding, while picking up wood for fabrication, that I’d make a little basketball court with a backboard.

Instead of a hoop/net, I decided to keep the red solo cup with its bottom cut out— either to make sure that the ball didn’t roll off the court and off the contact points, or out of subconscious college beer pong flashbacks. I cut a piece of wood, painted a free throw line, and grabbed a piece of acrylic from the free bin for the backboard. To complete the court, I borrowed a wooden dowel from Jake, drilled a small hole in the wood, and stuck in the dowel for the goal post. I glued the wires along the perimeter of the backboard behind white paint and taped them onto the goal post with blue tape (a-la- the foam padding on real goal posts) to hide away the wiring as much as possible.

In case it’s not visible, I put two pieces of foil on the court inside the solo cup with a narrow sliver of space in between them. I connected one of them to the positive wire connected to the light and the other to another piece of positive wire leading back to the power source. The ground wire was attached to the negative pole of the light. After hitting a shot into the cup, the piece of foil completed the circuit by connecting the two pieces of foil (and the positive part circuit wire.)

I tested the circuit to make sure it worked along the way. Along the way, it turned out that I needed a few soldering jobs to make sure everything worked according to plan. More on that below!

Help! I need somebody

I haven’t studied circuits since 2005. Given the rapid pace of our classes, getting up to speed is a team effort. Special thanks to Ben, Noah and Helen for helping me learn how to solder — never done it before! — and Cy for ideas for improving the connectivity of my circuit + taking pics. Shoutout to Emily and Jake for videos as well!

Thanks to everyone above for all the help! Noah pictured here teaching me how to solder. (Ben and Helen not pictured)

Thanks to everyone above for all the help! Noah pictured here teaching me how to solder. (Ben and Helen not pictured)

Final product for PComp Week 2 Switch assignment

Final product for PComp Week 2 Switch assignment